ESP-PROG dont work (OCD-299) #140
Comments
|
Cross-reference to PlatformIO forum post. |
|
Hi @iolaso Please also verify that TDI signal connection is correct. Given that OpenOCD is reading some stray zeroes from the scan chain, it looks like TDI is always sampled low. I see two possible situations when this may happen:
|
|
thanks for the answer, I solder the wires as you can see and the result is te same. By the way I set debug_speed=20. |


|
But now there's no shared GND connection between the programmer and board? |
|
same usb port |
|
but you are right, I forget it |
|
I trying with the blink project from ESP_IDF, it is ok? |
|
Alright in that case it might work to share GND.
It should work the same, you can also try and use the arduino-blink instead. Have you also checked continuity between the JTAG connections from the ESP-Prog to the IO12 to IO15 pins on the ESP32? Per schematic and labeled pins on the ESP-WROVER module. |
|
nothing has changed, same error |
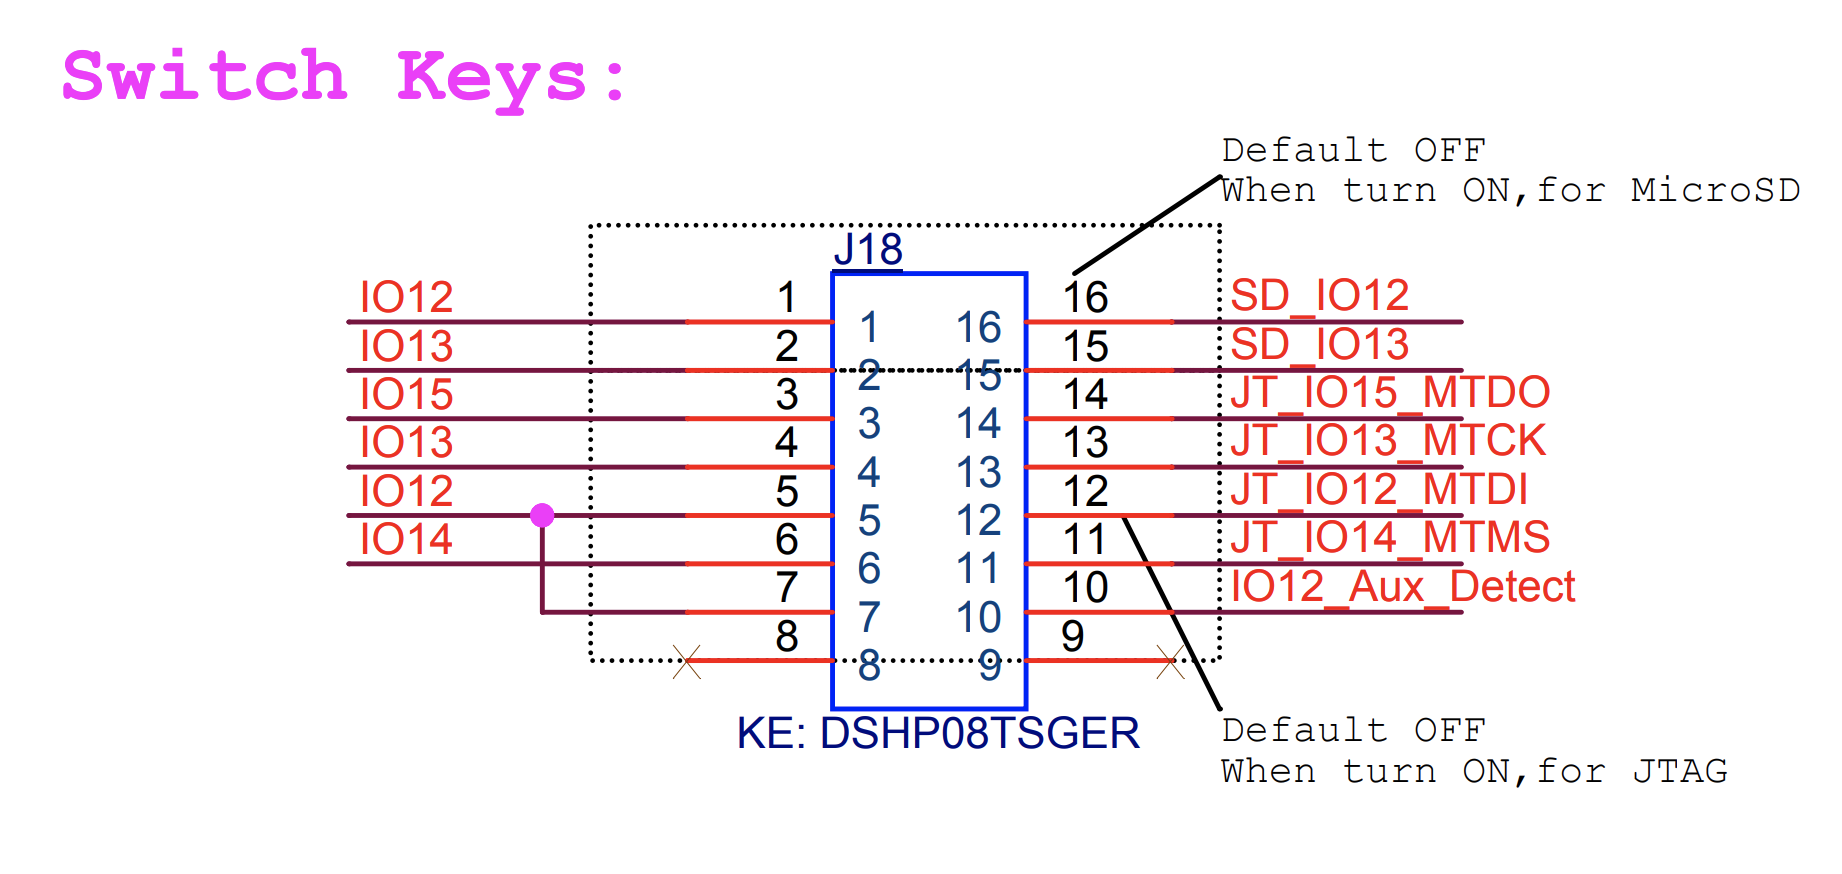
Checked, all seems be ok. MTMS IO14, MTCK IO13, MTDO IO15, MTDI IO12. |
|
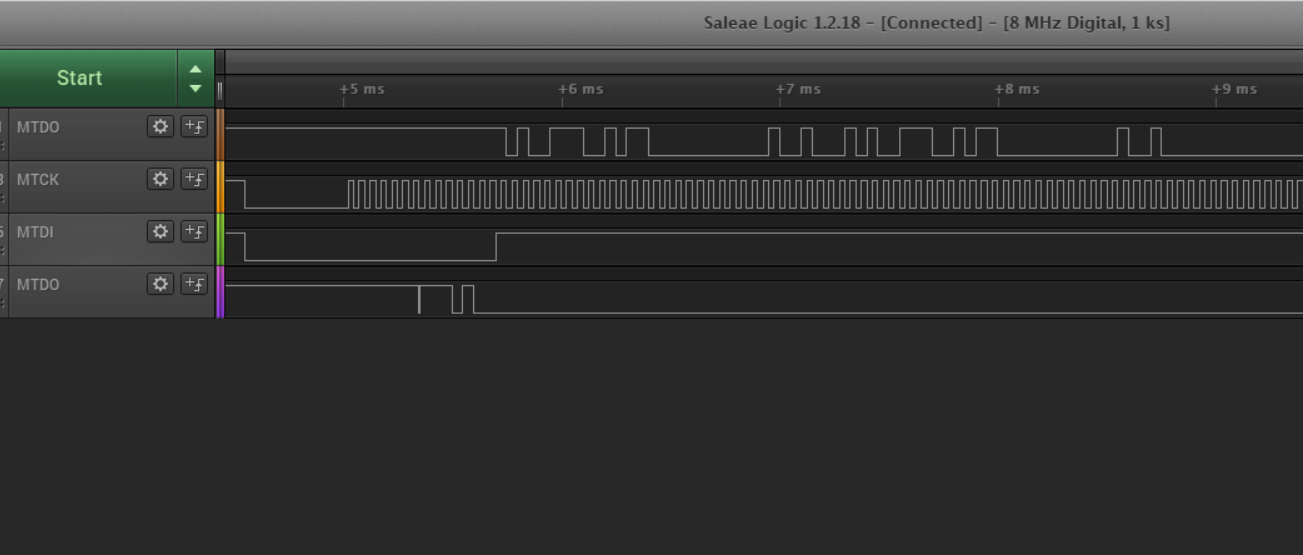
Which signal is the 3rd one on the logic analyzer traces above? It seems to be always low. |
Sorry. The order is the next:
|
|
Okay, so MTDI is indeed always low, as suggested in #140 (comment). Either some signal on the development board is driving this pin low (Aux detect?), or you got a faulty ESP-PROG board where MTDI is not connected to the FT2232H. You can distinguish between these possibilities by disconnecting MTDI pin of ESP-PROG from the development board, and attaching the logic analyzer to the MTDI of ESP-PROG. If it is still always low, then ESP-PROG is faulty. If you see that MTDI toggles or is high, then ESP-PROG is fine, but something on the development board is driving the MTDI line low. |
|
ok |
|
I probe it, the EPS-PROG set the MTDI pin to HIGH state by default. |
|
Can you try turning DIP switch 7 off? It seems to be connecting Aux detect signal to MTDI.
|
|
ok |
|
Sorry, I had a mistake. The MTDI on the ESP-prog is always off |
|
So it was the DIP switches? Or something on the ESP-prog device? How did you fix it? |
|
I dont fix it |
The MTDI pin of the ESP-PROG disconnected for the deleveloment board is low also, so seems like the programmer is faulty. |
|
ok, so I check the TDI pin of the ESP-PROG and is in low state, but I dont know what this means. Whats de default state of the TDI pin or how can I check if the ESP-PROG is faulty? |
|
Can you check please, if the TDI pin of your ESP-PROG is on High status by default? |
Hi, the picture says turn on with JTAG but when, how can I probe that. |
for JTAG, sorry. |
|
Hi, I soldered a wire to the pin 17 (MTDI) of the IC to check the status and this is the result. |

|
Closed due to inactivity. |
|
I have the same board, same programmer, same problem. I disconnected AUX and worked straight away. Thank you! |
Hi.
Im trying to use ESP-PROG to debug on Platform io and the sesult is the next:
Info : tcl server disabled
Info : telnet server disabled
Info : clock speed 5000 kHz
Info : JTAG tap: esp32.cpu0 tap/device found: 0x120034e5 (mfg: 0x272 (Tensilica), part: 0x2003, ver: 0x1)
Info : JTAG tap: esp32.cpu1 tap/device found: 0x120034e5 (mfg: 0x272 (Tensilica), part: 0x2003, ver: 0x1)
Info : TAP auto0.tap has invalid IDCODE (0x0)
Info : TAP auto1.tap has invalid IDCODE (0x0)
Info : TAP auto2.tap has invalid IDCODE (0x0)
Info : TAP auto3.tap has invalid IDCODE (0x0)
Info : TAP auto4.tap has invalid IDCODE (0x0)
Info : TAP auto5.tap has invalid IDCODE (0x0)
Info : TAP auto6.tap has invalid IDCODE (0x0)
Info : TAP auto7.tap has invalid IDCODE (0x0)
Info : TAP auto8.tap has invalid IDCODE (0x0)
Info : TAP auto9.tap has invalid IDCODE (0x0)
Info : TAP auto10.tap has invalid IDCODE (0x0)
Info : TAP auto11.tap has invalid IDCODE (0x0)
Info : TAP auto12.tap has invalid IDCODE (0x0)
Info : TAP auto13.tap has invalid IDCODE (0x0)
Info : TAP auto14.tap has invalid IDCODE (0x0)
Info : TAP auto15.tap has invalid IDCODE (0x0)
Info : TAP auto16.tap has invalid IDCODE (0x0)
Info : TAP auto17.tap has invalid IDCODE (0x0)
Info : TAP auto18.tap has invalid IDCODE (0x0)
Warn : Unexpected idcode after end of chain: 83 0x00000000
Warn : Unexpected idcode after end of chain: 115 0x00000000
Warn : Unexpected idcode after end of chain: 147 0x00000000
Warn : Unexpected idcode after end of chain: 179 0x00000000
Warn : Unexpected idcode after end of chain: 211 0x00000000
Warn : Unexpected idcode after end of chain: 243 0x00000000
Warn : Unexpected idcode after end of chain: 275 0x00000000
Warn : Unexpected idcode after end of chain: 307 0x00000000
Warn : Unexpected idcode after end of chain: 339 0x00000000
Warn : Unexpected idcode after end of chain: 371 0x00000000
Warn : Unexpected idcode after end of chain: 403 0x00000000
Warn : Unexpected idcode after end of chain: 435 0x00000000
Warn : Unexpected idcode after end of chain: 467 0x00000000
Warn : Unexpected idcode after end of chain: 499 0x00000000
Warn : Unexpected idcode after end of chain: 531 0x00000000
Warn : Unexpected idcode after end of chain: 563 0x00000000
Warn : Unexpected idcode after end of chain: 595 0x00000000
Warn : Unexpected idcode after end of chain: 627 0x00000000
Error: double-check your JTAG setup (interface, speed, ...)
Error: Trying to use configured scan chain anyway...
Warn : AUTO auto0.tap - use "jtag newtap auto0 tap -irlen 2 -expected-id 0x00000000"
Error: auto0.tap: IR capture error; saw 0x0000 not 0x0001
Warn : Bypassing JTAG setup events due to errors
Info : accepting 'gdb' connection from pipe
Warn : No symbols for FreeRTOS!
Error: Target not examined yet
Error executing event gdb-attach on target esp32.cpu0:
Error: Target not halted
Error: auto_probe failed
Error: Connect failed. Consider setting up a gdb-attach event for the target to prepare target for GDB connect, or use 'gdb_memory_map disable'.
Error: attempted 'gdb' connection rejected
Error: error during select: Unknown error
.pioinit:11: Error in sourced command file:
Remote communication error. Target disconnected.: No error.
Can anyone help me?
The text was updated successfully, but these errors were encountered: