This is forked version of lorieri/deis-dashboard
Deis Dashboard is a "real time" only http connections dashboard for the Open Deis PaaS
- A deis cluster
- Backend daemon: deis-dashback
First, you need to setup some service units on your cluster. Start by SSH-ing to one of your cluster servers. Then, do the following:
# Clone the project
$ git clone https://github.com/lorieri/deis-dashboard.git
$ cd deis-dashboard

# Start the backend in the cluster
$ fleetctl start deis-dashback.service

# Start the log collection
$ fleetctl start deis-dashcollect.service
After that, from your development machine:
# Clone the project
$ git clone https://github.com/lorieri/deis-dashboard.git
$ cd deis-dashboard

# Create and configure your app
$ deis create deis-dashboard
$ deis config:set ETCD_HOSTS=http://myhost1:4001,http://myhost2:4001,http://myhost3:4001

# Deploy the app:
#
# There are two ways to deploy deis-dashboard:

# by Dockerfile
$ git push deis master

# *OR*

# by Docker Hub
$ deis pull lorieri/deis-dashboard

# Open it on a web browser
$ deis open
If the installation succeeded, you may see the dashboard screen (see screenshots) bellow. If you are not able to see your apps try sending some traffic in your cluster and wait for around 10 seconds.
The Main Page shows 3 charts
- A pie that shows the percentage of requests of the apps related to cluster total
- A pie that shows the percentage of bytes transfered of the apps related to cluster total
- A bar chart that shows total errors and total successed requests stacked by app
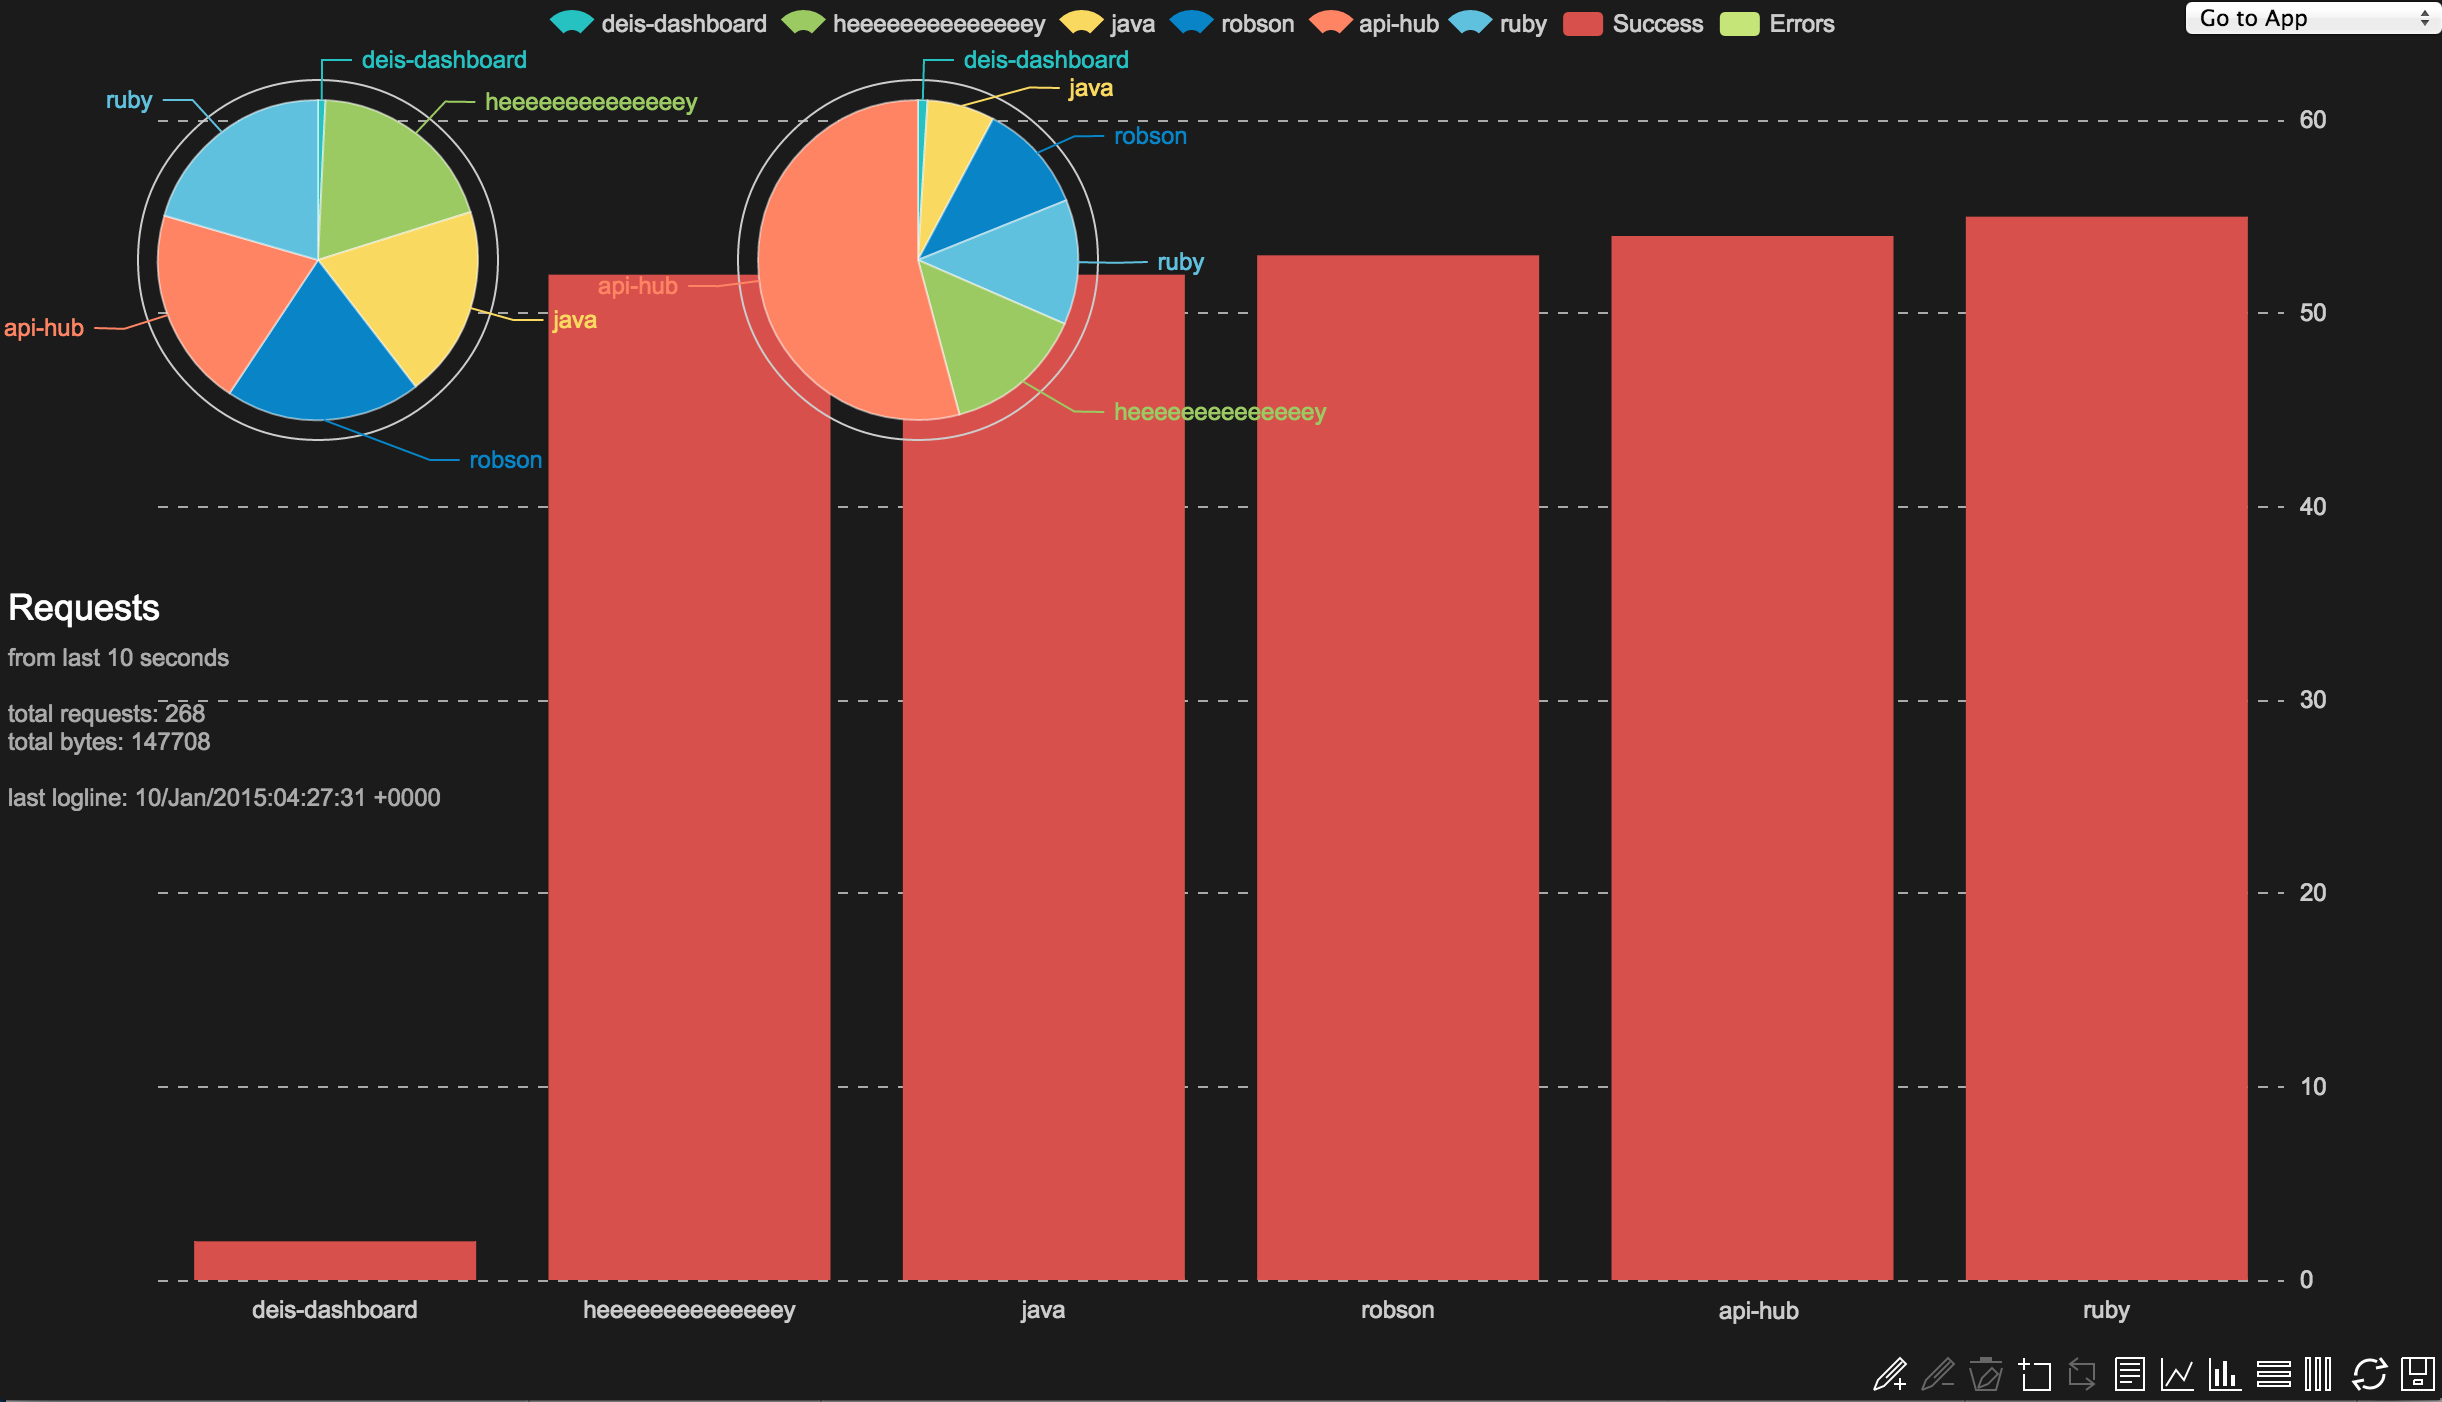
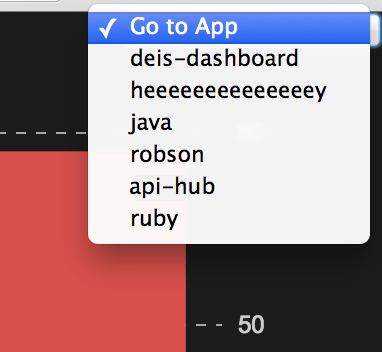
In the top right of the page there is a link for the current apps
The Apps Page show statistics for the last 10 seconds of traffic and 2 horizontal bars:
- total requests
- % of successes / % of errors
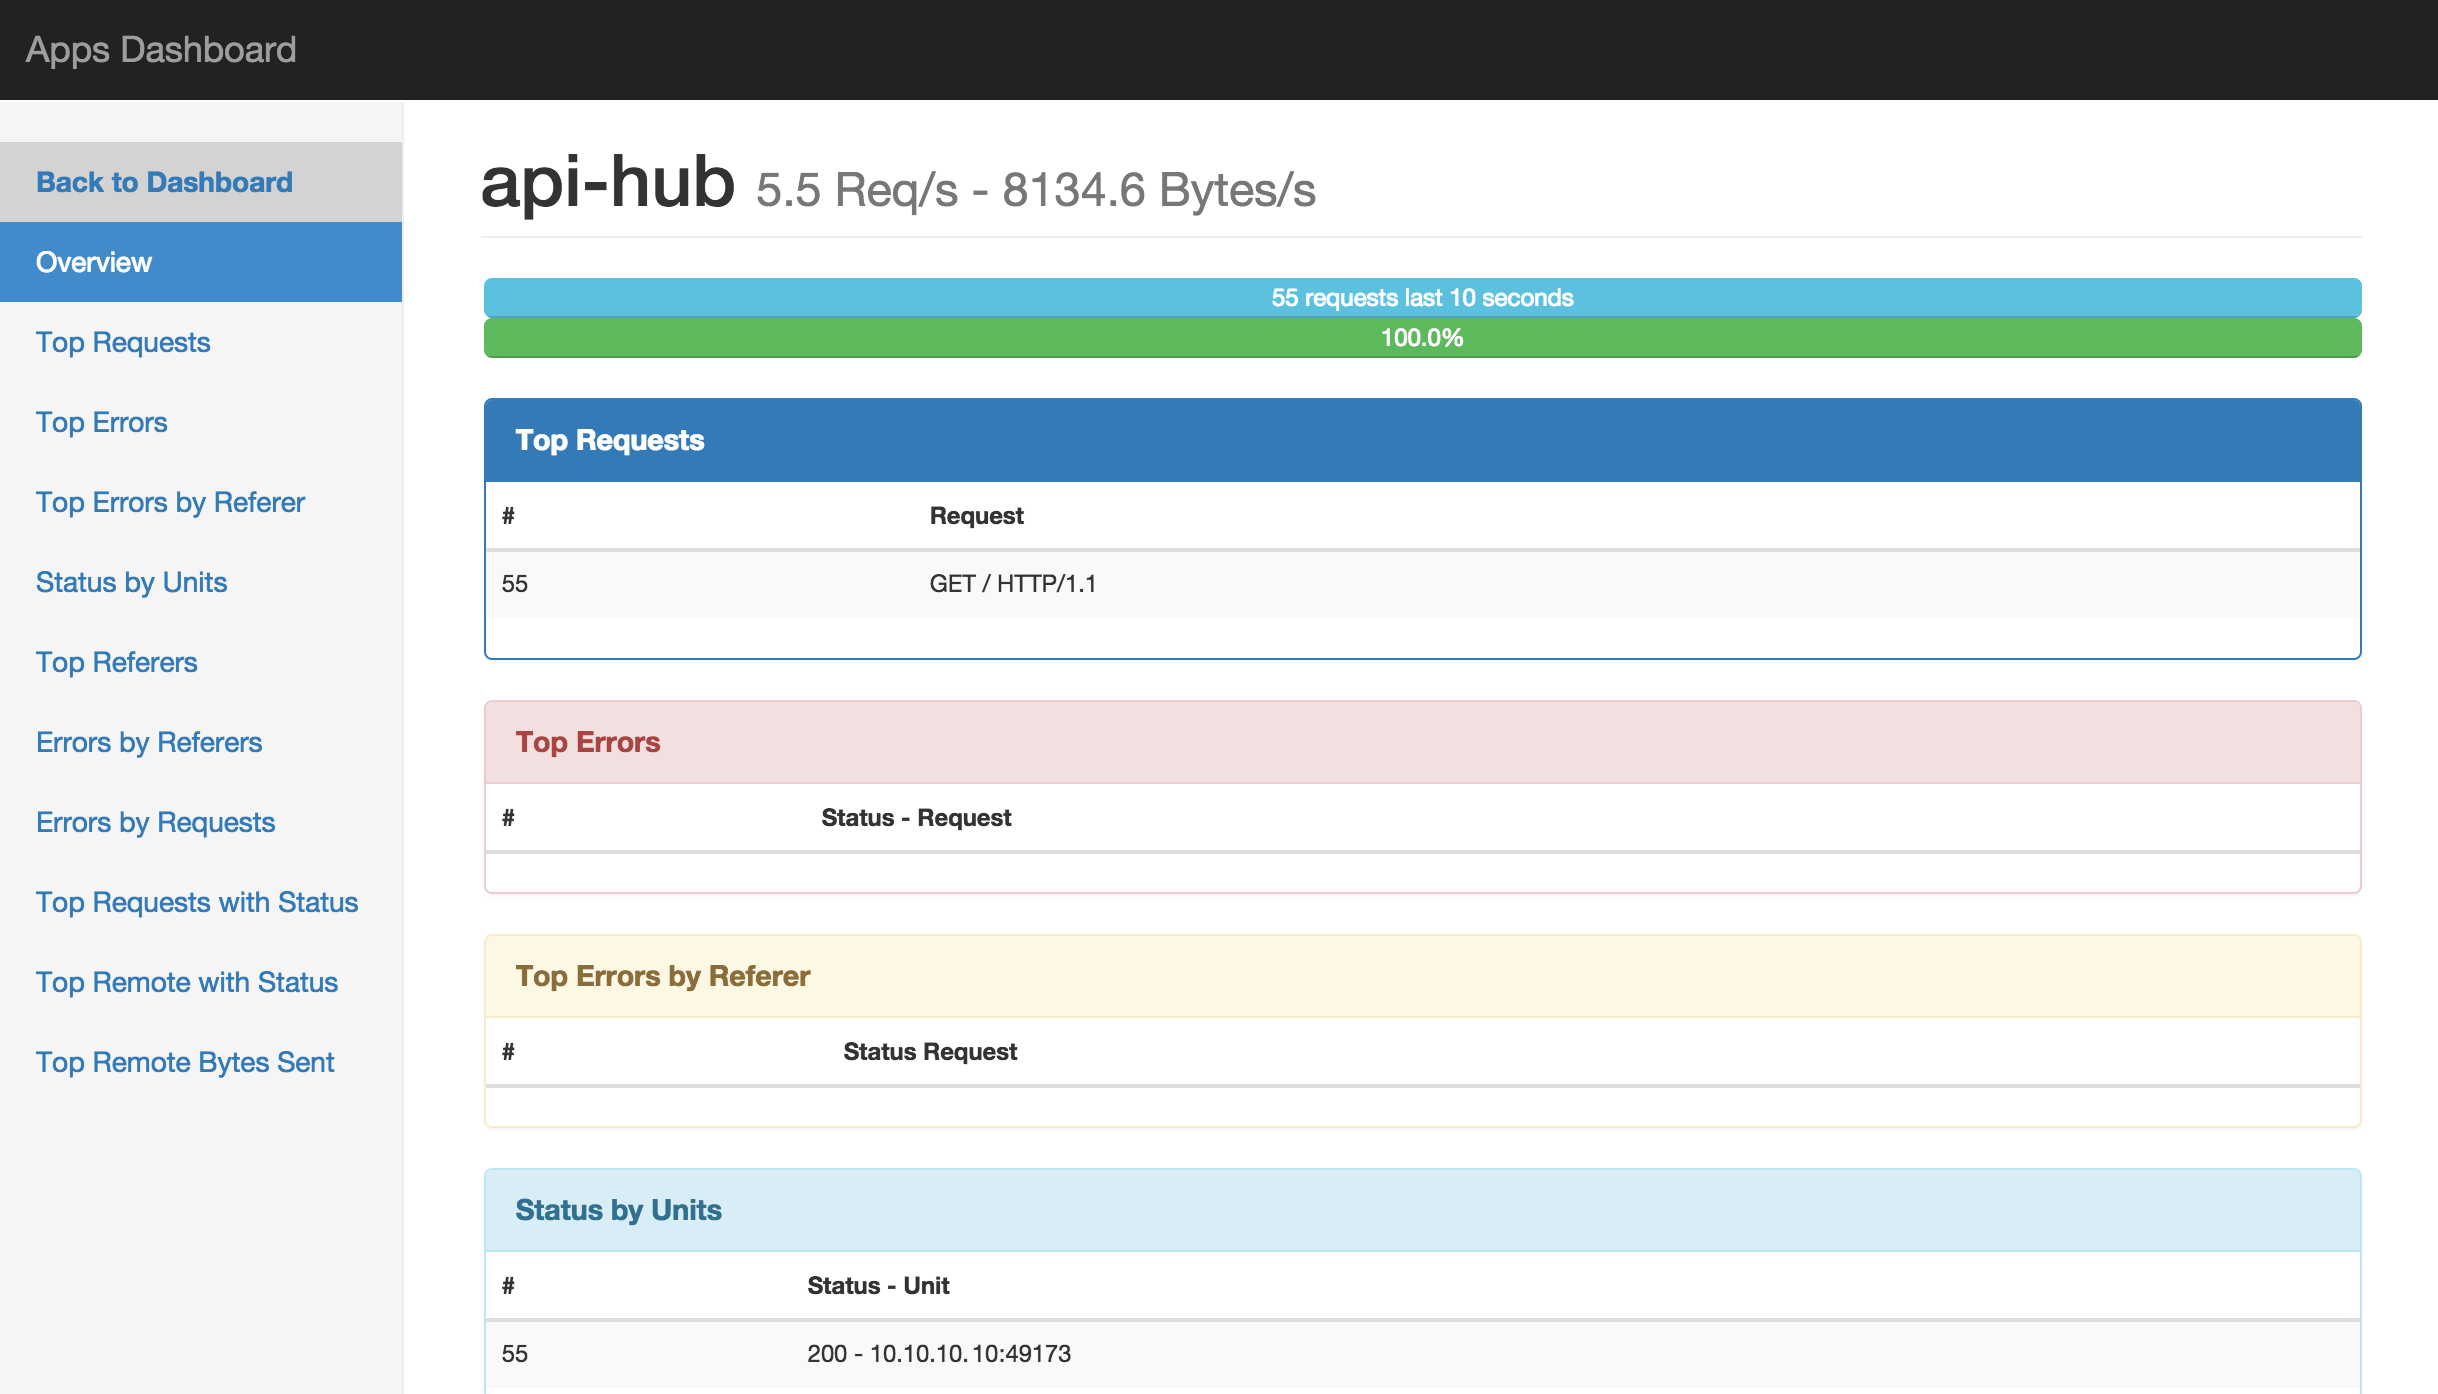
Apps page's navigation menu
