Disassembly View
The disassembly view is broken up into two parts, the actual code view, and the analysis view.
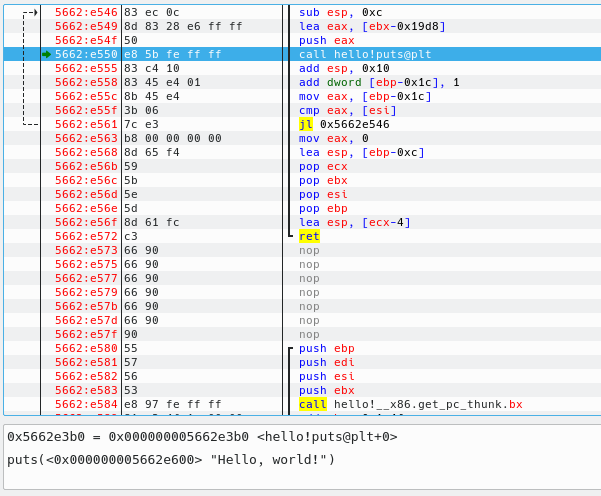
The code view is fairly straight forward, it currently has 4 columns.
- The address (and possibly the label) of each instruction
- The bytes of the code at that address
- The disassembly of those bytes
- User comments. Future versions will have analysis generated comments as well
Below the disassembly is the analysis of the code currently at the instruction pointer. Here you will see many different things such as the value of any expressions or registers used as operands, whether or not a condition jump will be taken, and in some cases a pseudo-C syntax version of a call to a known library function. It is planned to have the analysis be more predictive, and have the ability for user-supplied function signatures as well.