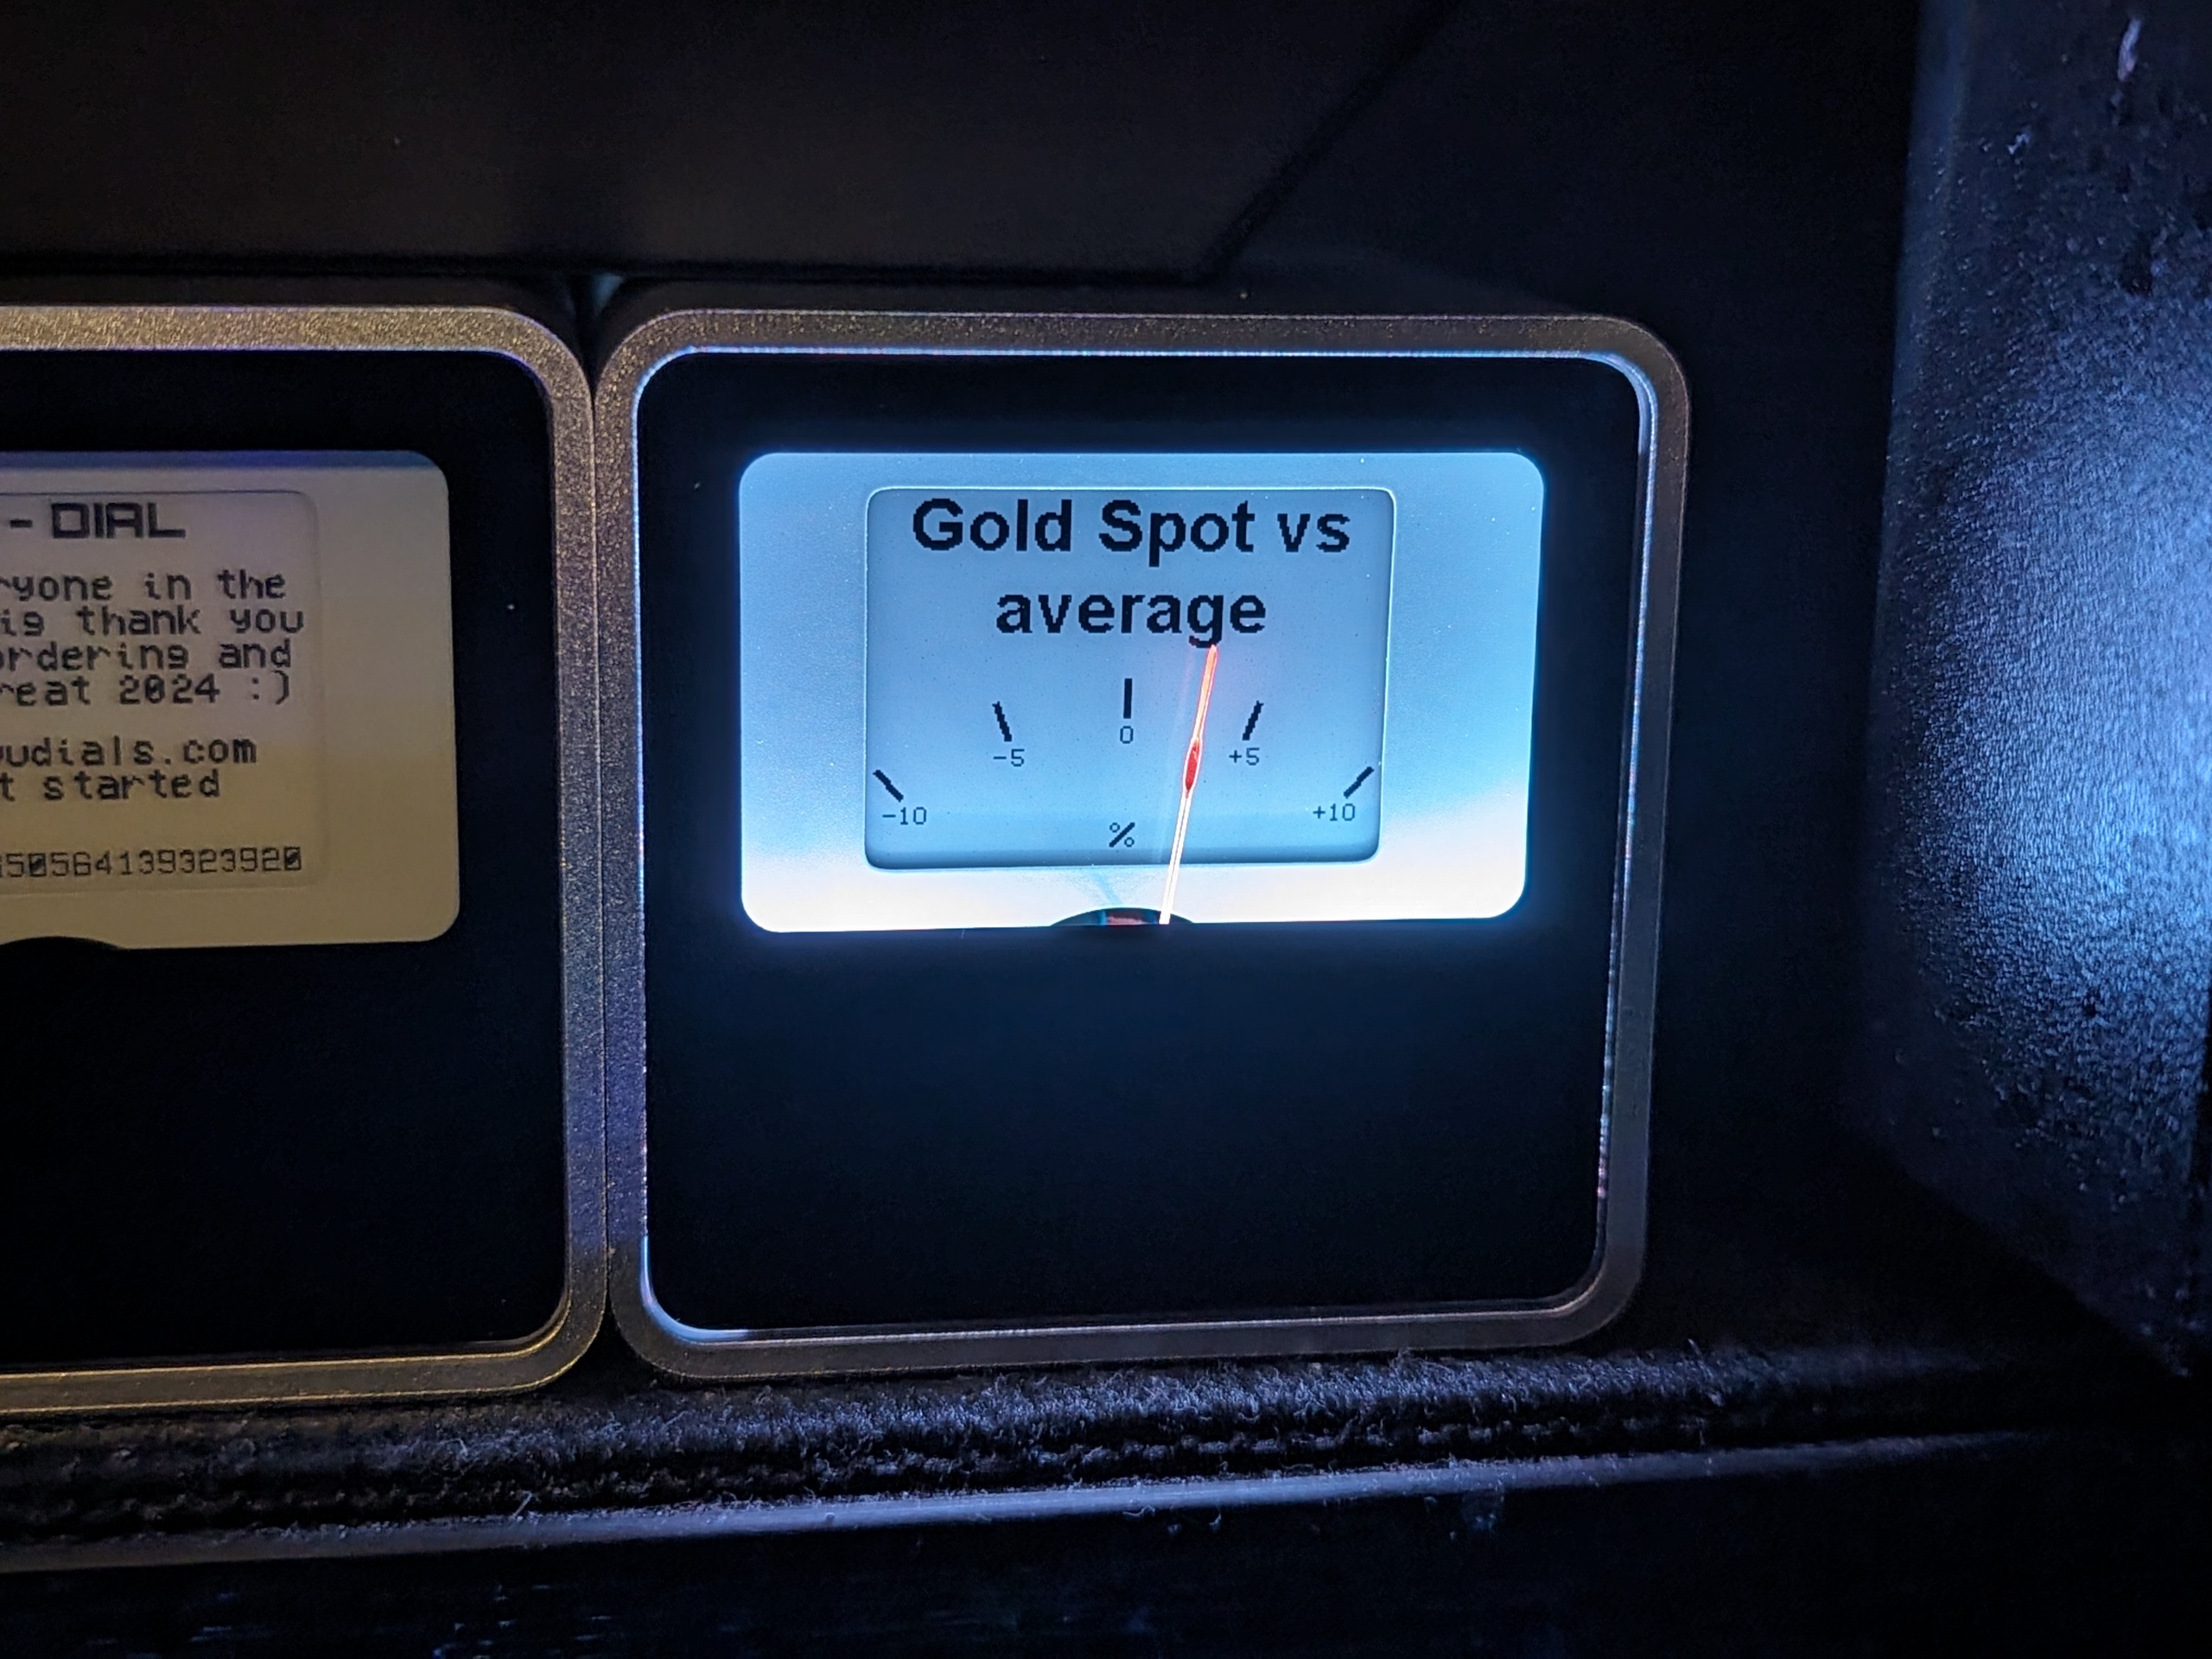
This script scrapes the gold price per ounce in $ or €. You put your average buy price per ounce into the scripts header variables.
The script then calculates the price deviation from your average, uploads a -10%/+10% background image and then calculates the needle position.
The lower the price falls below your average price, the greener the display gets. It's time to buy!
The higher the price above your average climbs, the redder the LED gets. This is a bad time to buy to lower your average, but maybe a good time to sell and take profits? Maybe just the ugly coins?
If it's hovering somewhere around +-0%, the LED is white.
TODO:
- replace wget with curl
- move API keys to a configuration file
- upload a image that matches your deviation from the current price. What if it's +20%?
- inject the actual spot and average prices into the image!
- Find a better 1-Bit-font
- Maybe write an attract mode where the needle moves about and the colors change, for fun ;-)
- Add Yen and Pound as currency
- Use shellcheck
- Command line parameter and option parsing for help, debug and so on