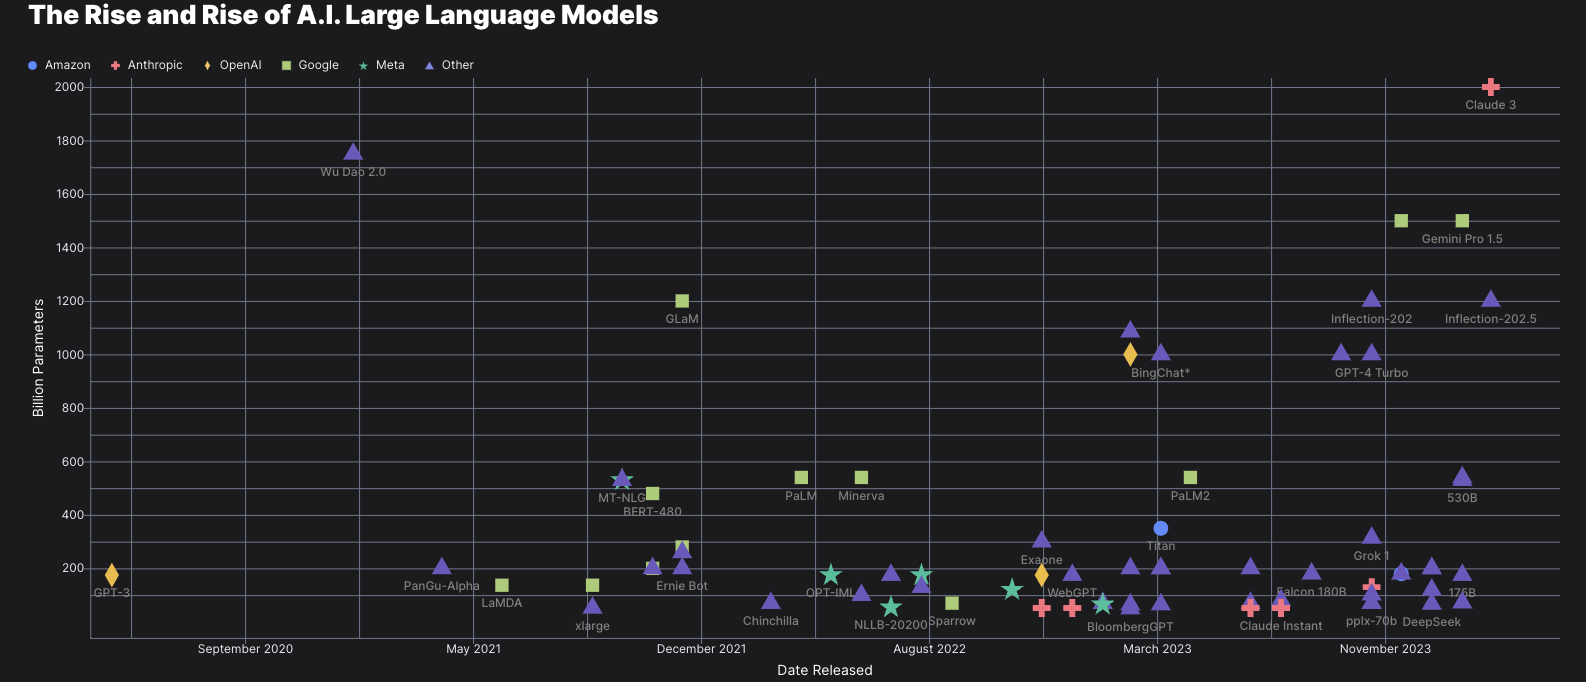
Website | Gallery: Scatter Plot with Varied Shape #370
Conversation
| label={useCallback((d: DataRecord) => d.name, [])} | ||
| labelPosition={Position.Bottom} | ||
| labelHideOverlapping={true} | ||
| labelColor="grey" |
There was a problem hiding this comment.
The grey color looks a bit dark in the dark mode.
There was a problem hiding this comment.
Good call. Updated to use the default color.
cf972d6
to
8b7fdc1
Compare
| 'triangle', | ||
| ] | ||
|
|
||
| export const sumCategories = (category: string): string => { |
There was a problem hiding this comment.
I'm not sure this function is necessary. I see you're using it to map category to the color/shape, but scaleOrdinal should already implement that logic for you. See my other comment below
There was a problem hiding this comment.
sumCategories also put any owner that's not in const categories into Other.
There was a problem hiding this comment.
Fair point. I think it still works without it but this way it clearer, so let's keep it
There was a problem hiding this comment.
Do you mean we can get rid of sumCategories entirely and call getColor = (d: DataRecord): string => colorScale(d.owner) and shapeScale(d.owner) directly? I'm not sure if that would work. Because then, in the data set, if the owner isn't part of the 6 categories, (like owner: 'Inflection'), it will get mapped to a different shape and color instead of Other right? Or am I missing something?
I don't want to have inaccurate examples, so I'm happy to update if that's the case!
There was a problem hiding this comment.
@lee00678 Yeah so I actually just tried it myself and it does work (feel free to try it too and verify). I think under the hood the scaleOrdinal automatically bins extraneous values into the last value of the provided range.
But that doesn't mean your example is inaccurate, if anything it is more clear. So I approved this PR you can go ahead and merge if you like. Or if you want to change it, that's fine too. I'll leave it up to you :)
There was a problem hiding this comment.
Thanks for the review! I didn't know this feature about scaleOrdinal.
packages/shared/examples/shaped-scatter-plot/shaped-scatter-plot.component.html
Outdated
Show resolved
Hide resolved
packages/shared/examples/shaped-scatter-plot/shaped-scatter-plot.component.ts
Show resolved
Hide resolved
8b7fdc1
to
30b1123
Compare
Adding an example to gallery for scatter plot with varied shape.
issue
I'm not sure if the best way to map
shapesis to use an array inside data. If there are better ways, please let me know, I'm happy to change it.