git-greenseer

This repo is archived: use https://github.com/ferzerkerx/repo-stats as a replacement
Generates html report for a given git repository. Report shows:
-
Contribution percentage by category. (shows a bar chart)
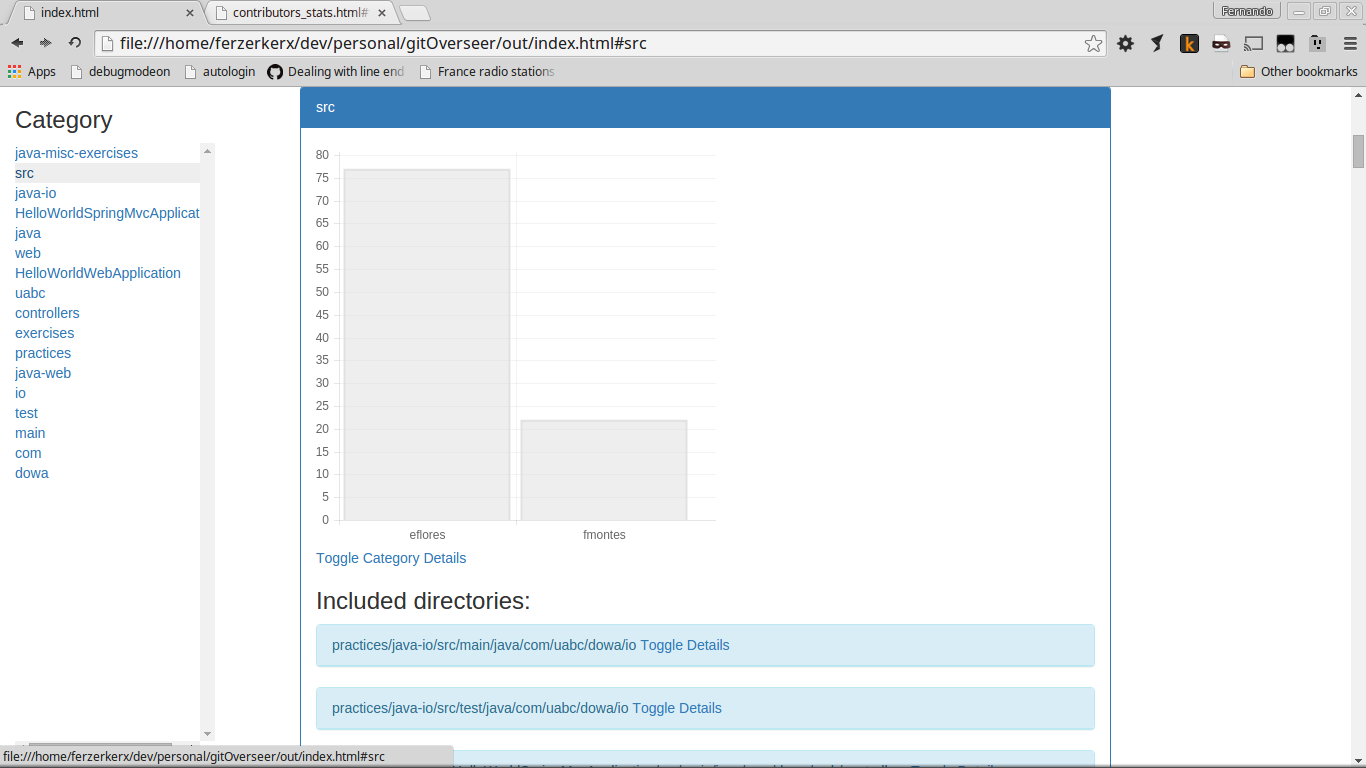
-
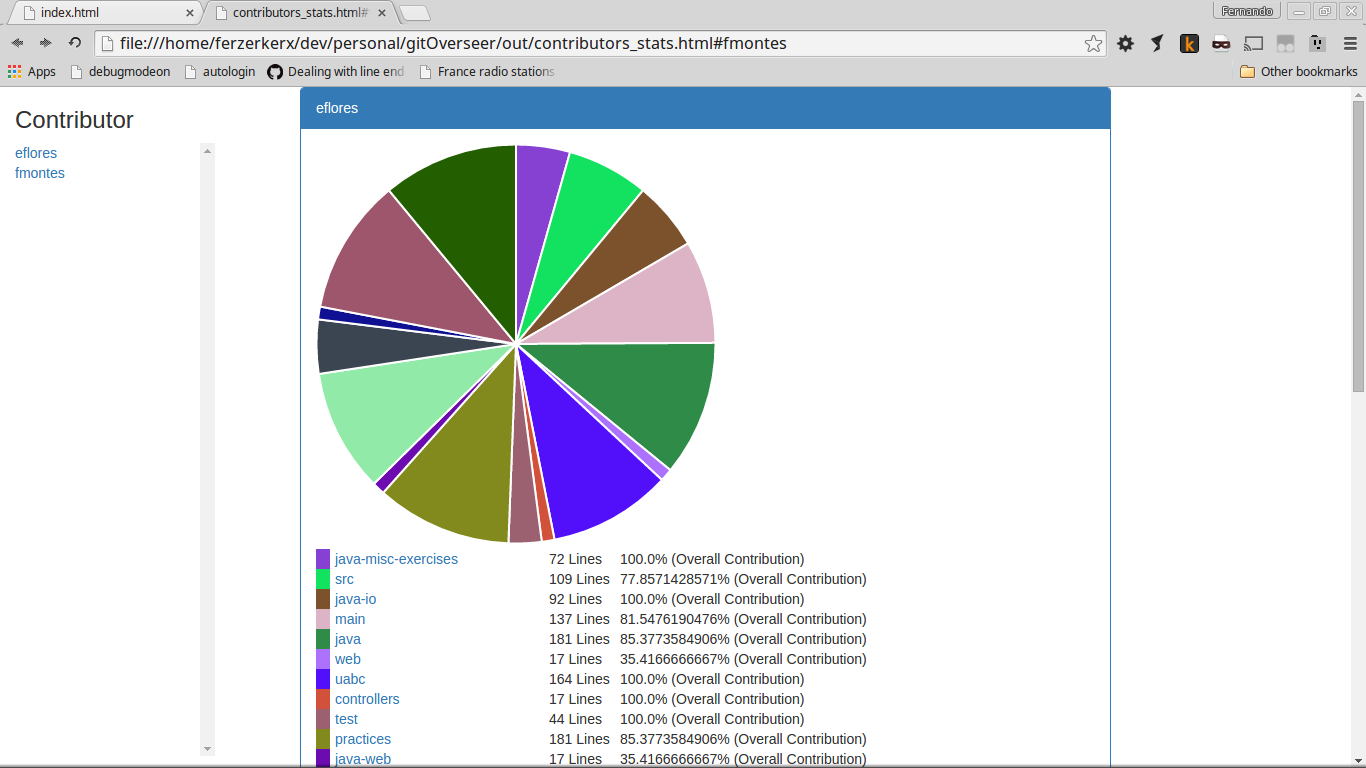
Contribution per developer for each category. (shows a pie chart)
- Jinja2 framework
- Bootstrap.js
- Charts.js
- Modify setup.py and change settings
- pip install -r requirements.txt
- python src/main/main.py /my/git/repo/path
- cd git-greenseer
- python -m unittest discover -s src -p '*_test.py'
- Obtains the list of files that are part of the git repository using: "git ls-files master ."
- For each listed file it counts the lines for each contributor using this command: "git blame HEAD --line-porcelain " + file_name + " | sed -n 's/^author //p' | sort | uniq -c | sort -rn" 3.Each file is assigned a category based on the path it has: /category1/category2/category3/ when we run it to identify category1 it will generate statistics for that category
Some of the entries show something like
79 Not Committed Yet
because of this:
http://stackoverflow.com/questions/4638500/git-blame-showing-no-history
SOLVED by adding HEAD to git blame
- Write more tests
- Add last date of commit per contributor per category
- Generate report per file (see old text report https://github.com/ferzerkerx/git-greenseer/commit/7452cfc4faf7482451f6a3fe8340d394a3dd5c59 print_stats_for_files_in_dir)
- Add cache
- Add a way to compare between branches