Real-Time Experimentation (RTX) tool allows for self-adaptation based on analysis of real time (streaming) data. RTX is particularly useful in analyzing operational data in a Big Data environment.
This is a managing system for CrowdNav. The seasonality extension allows it to simulate traffic fluctuations throughout time.
-
A traffic generator is defined in
TrafficParser.pyto generate the various attributes of a real-world traffic information.def __init__(self, reference_mean=1000, dataset=None, minute_in_step=15, rescale_time=None, extend="Loop", model="Fourier", interpolate="linear", interpolate_order=2, noiseScale=0, stream=False, remove_growth=False): -
It takes dataset and simulates traffic for infinite amount of time. Blue is the dataset. Orange is the simulated traffic based on the dataset

This is a guide for our team so everyone can spin-up and run properly the system. How to run the CrowdNav and RTX together properly:
Install SUMO 1.14.1 and add SUMO_HOME to PATH as it says in the guide.
Note that advertised host is localhost
docker run --name kafka --hostname kafka -p 2181:2181 -p 9092:9092 --env ADVERTISED_HOST=localhost --env ADVERTISED_PORT=9092 spotify/kafka- Git clone the CrowdNav repo
git clone https://github.com/fif911/CrowdNav.git - Install Python 2.7 locally (Proven to work with Python 2.7)
- Create virtual environment
- Run
python setup.py install - In
app/Config.pyset:
kafkaUpdates = True
kafkaHost = "localhost:9092"- Run
run.pyin environment
- Clone this RTX
git clone https://github.com/fif911/CrowdNav_RTX - Install Python 3. (Proven to work with Python 3.9)
- run
python setup.py install - run fixed version of RTX with
python rtx.py start examples/crowdnav-seasonality - check the logs,
seasonality_details.csvandresults.csv - To use Spark as a PreProcessor you also need to install Spark and set SPARK_HOME
Ensure the in definition.pysettings are:
primary_data_provider = {
    "type": "kafka_consumer",
    "kafka_uri": "localhost:9092",
    # ...
}

change_provider = {
    "type": "kafka_producer",
    "kafka_uri": "localhost:9092",
    # ...
}A first guide is available at this wiki page
RTX has the following abstractions that can be implemented for any given service:
- PreProcessor - To handle Big Data volumes of data, this is used to reduce the volume
- Example: Spark
- DataProviders - A source of data to be used in an experiment
- Example: KafkaDataProvider, HTTPRequestDataProvider
- ChangeProviders - Communicates experiment knobs/variables to the target system
- Example: KafkaChangeProvider, HTTPRequestChangeProvider
- ExecutionStrategy - Define the process of an experiment
- Example: Sequential, Gauss-Process-Self-Optimizing, Linear
- ExperimentDefinition - A experiment is defined in a python file
- See
./experiment-specification/experiment.py
- See
-
ExperimentsSeq - Runs a list of experiments one after another
experiments_seq = [ ... { "ignore_first_n_results": 100, "sample_size": 100, "knobs": { "exploration_percentage": 0.0 } } ... ] -
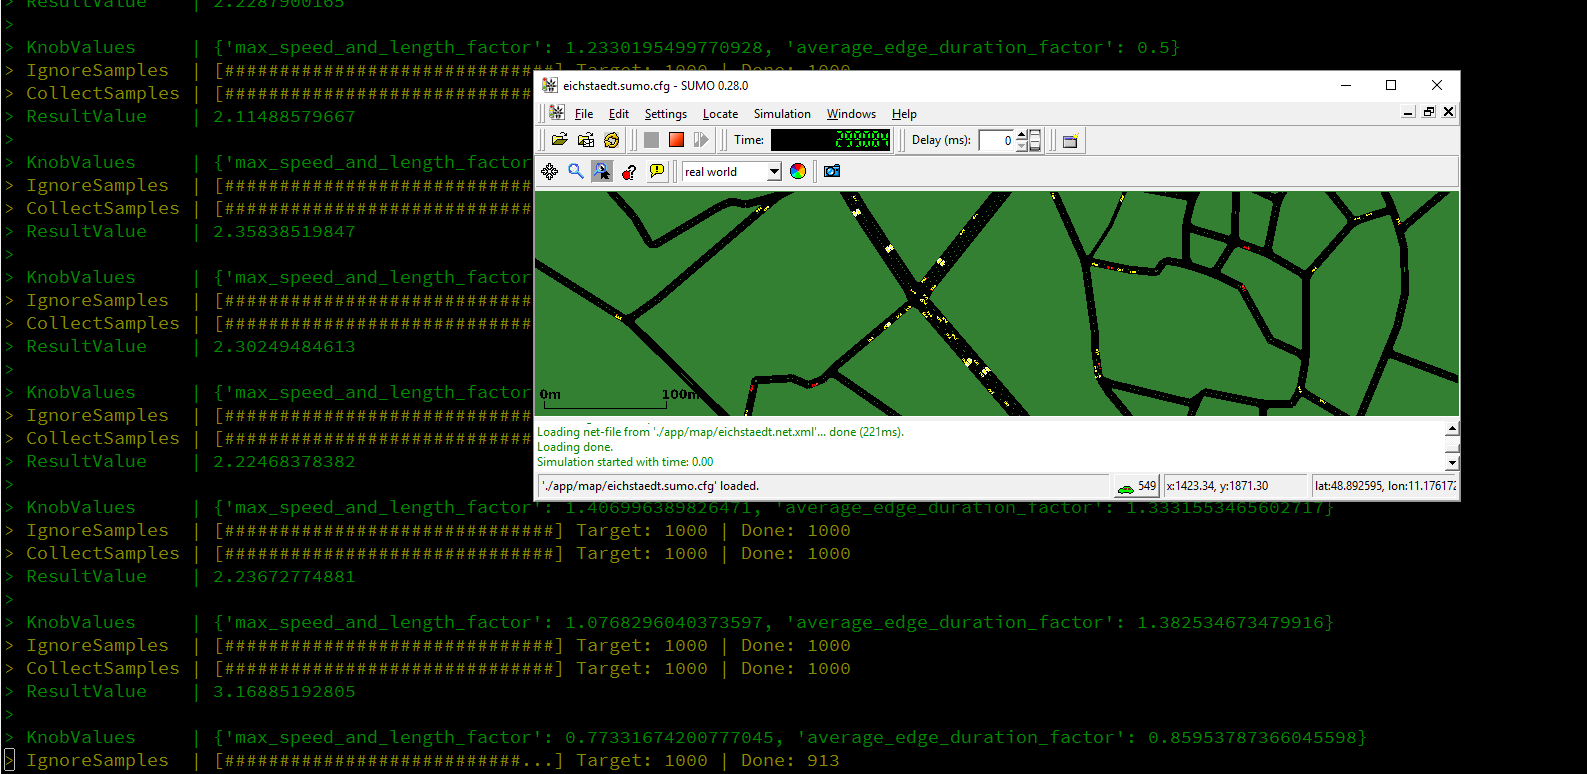
SelfOptimizer - Runs multiple experiments and tries to find the best value for the knobs
self_optimizer = { # Currently only Gauss Process "method": "gauss_process", # If new changes are not instantly visible, we want to ignore some results after state changes "ignore_first_n_results": 1000, # How many samples of data to receive for one run "sample_size": 1000, # The variables to modify "knobs": { # defines a [from-to] interval that will be used by the optimizer "max_speed_and_length_factor": [0.5, 1.5], "average_edge_duration_factor": [0.5, 1.5], } } -
StepExplorer - Goes through the ranges in steps (useful for graphs/heatmaps)
step_explorer = {
    # If new changes are not instantly visible, we want to ignore some results after state changes
    "ignore_first_n_results": 10,
    # How many samples of data to receive for one run
    "sample_size": 10,
    # The variables to modify
    "knobs": {
        # defines a [from-to] interval and step
        "exploration_percentage": ([0.0, 0.2], 0.1),
        "freshness_cut_off_value": ([100, 400], 100)
    }
}
-
In
KafkaConsumerDataProvider.py, values sent from CrowdNav throught Kafka is recieved by RTX. It also provides a connection to traffic generator, which is used for generate real-world traffic data.try: self.kafka_uri = cp["kafka_uri"] self.topic = cp["topic"] self.serializer = cp["serializer"] info( "> KafkaConsumer | " + self.serializer + " | URI: " + self.kafka_uri + " | Topic: " + self.topic, Fore.CYAN) ... self.consumer = KafkaConsumer(bootstrap_servers=self.kafka_uri, value_deserializer=self.serialize_function, enable_auto_commit=False, group_id=None, consumer_timeout_ms=3000) # subscribe to the requested topic self.consumer.subscribe([self.topic])
-
In
definition.pyofcrowdnav-seasonality, Various functions are defined for seasonality analysis. -
primary_data_reducer - Processes data sent when smart car arrives
-
ticks_data_reducer - Processes data sent on every 30 ticks in CrowdNav by default
-
primary_data_provider - RTX registers as a customer of Kafka to subscribe messages from CrowdNav returned values
primary_data_provider = { "type": "kafka_consumer", "kafka_uri": "localhost:9092", "topic": "crowd-nav-trips", "serializer": "JSON", "data_reducer": primary_data_reducer } -
change_provider - RTX also registers as a provider of Kafka to provide change directives
change_provider = { "type": "kafka_producer", "kafka_uri": "localhost:9092", "topic": "crowd-nav-commands", "serializer": "JSON", } -
secondary_data_providers - RTX again registers as a customer of Kafka to subscribe messages for tick recording
secondary_data_providers = [ { "type": "kafka_consumer", "kafka_uri": "localhost:9092", "topic": kafkaTopicTick, "serializer": "JSON", "data_reducer": ticks_data_reducer } ] -
evaluator - Function to evaluate goodness of the knobs in the experiment
-
state_initializer - Initilize every state when experiment starts
-
The result are saved in
seasonality_details.csv. According to the result we can find the differences between actual traffic volumes and expected volumes on every 30 ticks as set by defult in CrowdNav. As well as the differences of speeds between smart cars and normal cars.
