Home
RDP Inspector is a Firefox extension that intercepts Remote Debugging Protocol (RDP) and shows all data sent and received.
- The minimum required browser version is Firefox 38
Install latest RDP Inspector (or get from addons.mozilla.org)

- Displaying RDP Packets
- Packet Details Inspection
- Filtering Displayed Packets
- Get Summary Data
- Get Stacktrace Info
- Search In Packet List
- Sending Test Packet
- Registered Actors Inspection
- Monitor WebIDE Connections (in-progress)
Are you missing a feature? Create a report
You should see a new RDP Inspector button at the top-right corner of your browser window after installation (the final icon is under construction).
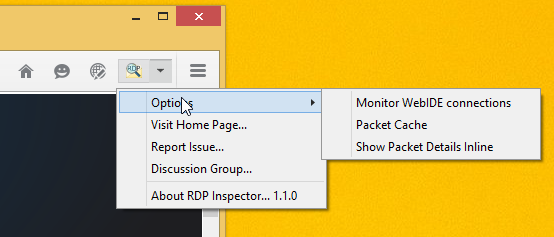
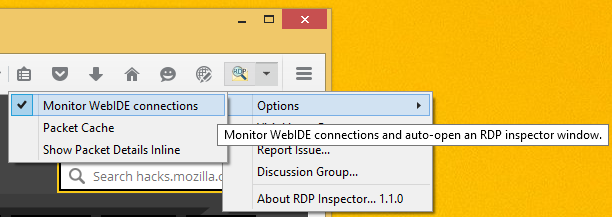
Clicking the down arrow on the right opens a pop-up menu with links and options (the same options can be accessed from the add-on preferences as well).
Clicking the button opens RDP Inspector console window.
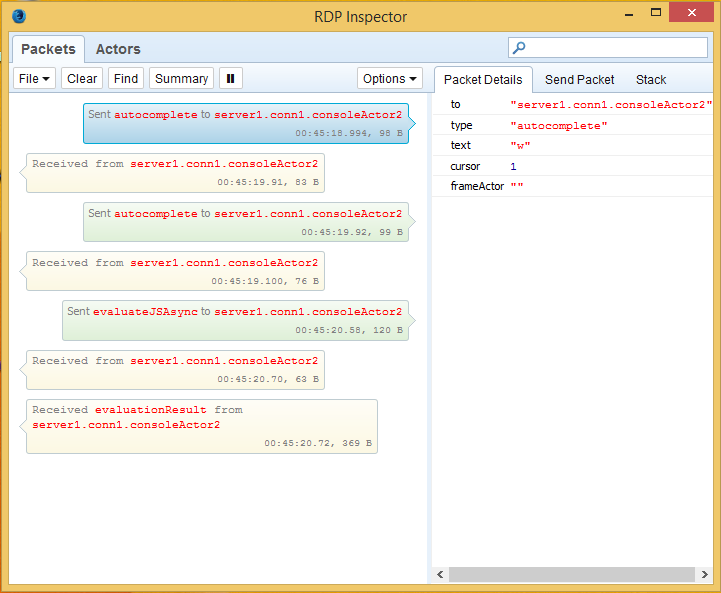
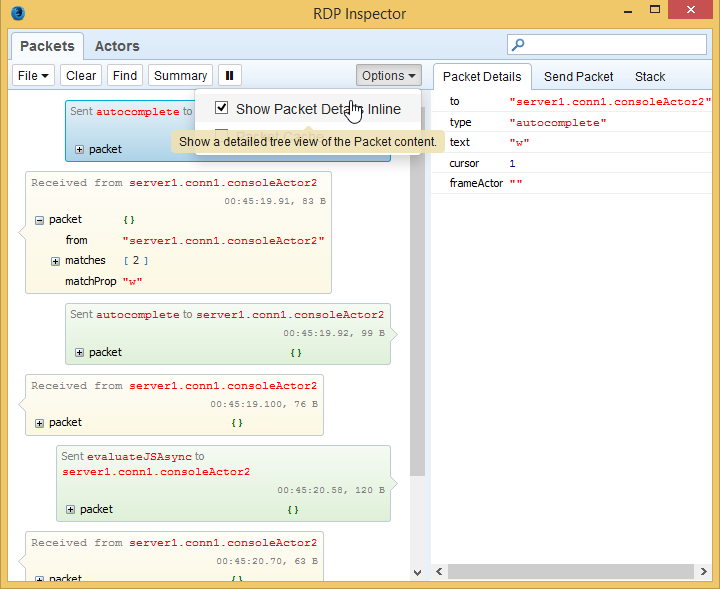
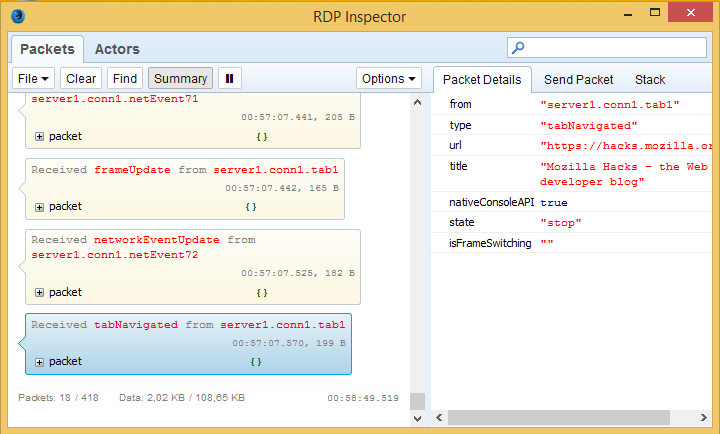
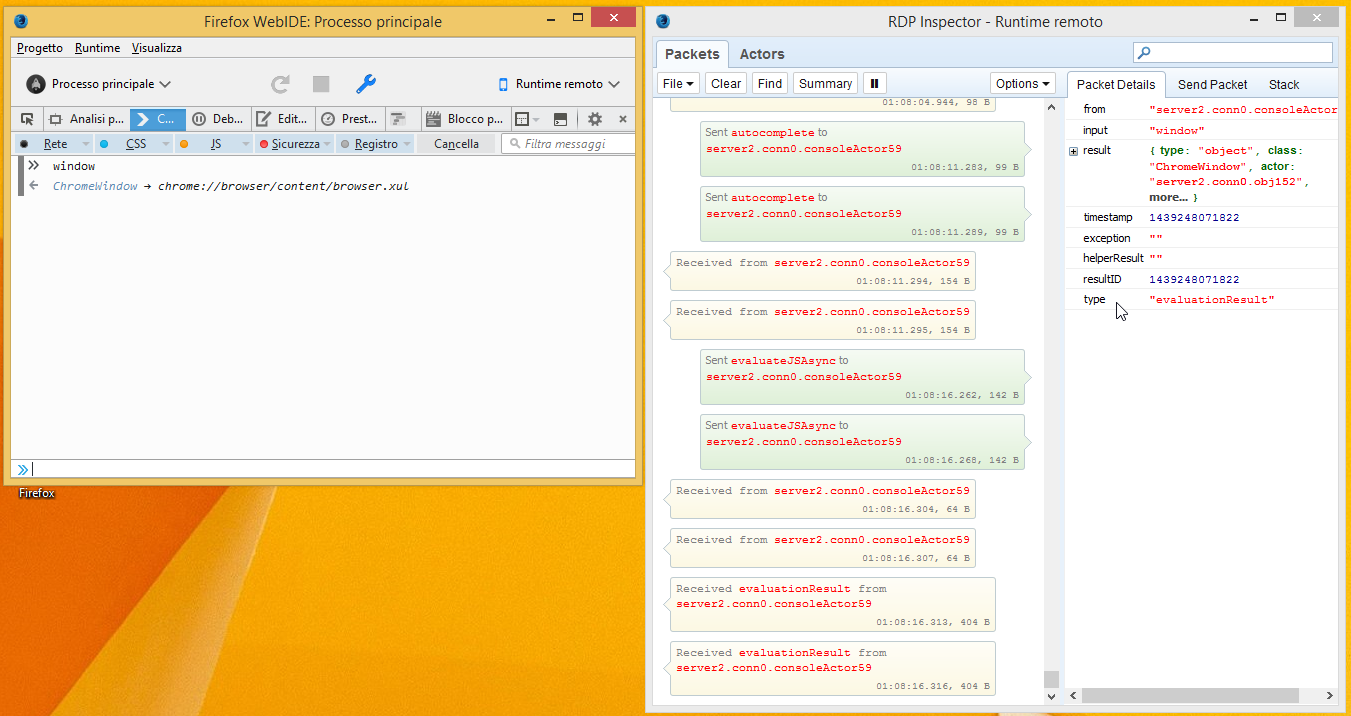
RDP Inspector shows also all packet properties as an expandable tree. There are two ways how to inspect packet details. Either select a packet in the list and see it in the Packet Details side panel or show packet details inline using an existing option.
The list of packets can be easily filtered by typing into a Search Box located at the top right corner of the console window.
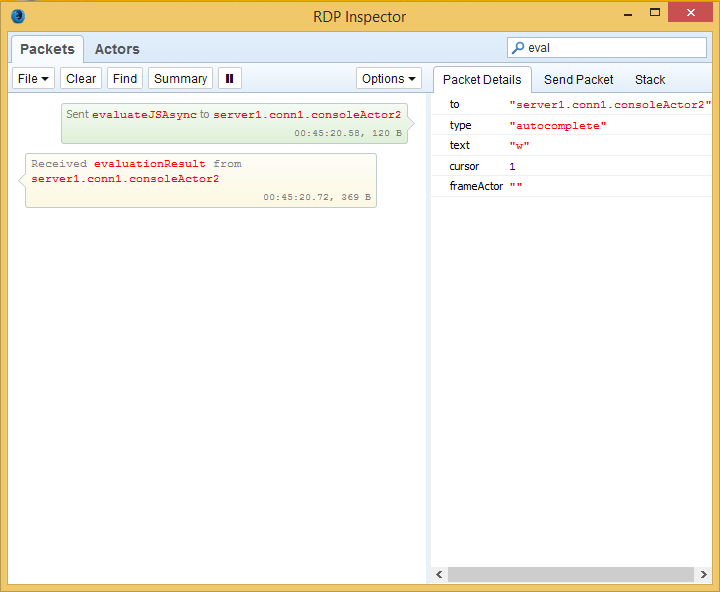
The screenshots above shows how to filter the list to see only "listTabs" packets.
RDP Inspector allows to get summary data at any time. Pressing the Summary button in the toolbar appends summary separator at the end of the list.
The screenshot above shows that 72 packets have been sent to the debugger server (total size 19,63 KB) and 95 packets have been received (total size 60,53 KB).
RDP Inspector allows to get stacktrace data to easily find which javascript code initiated the RDP communication:
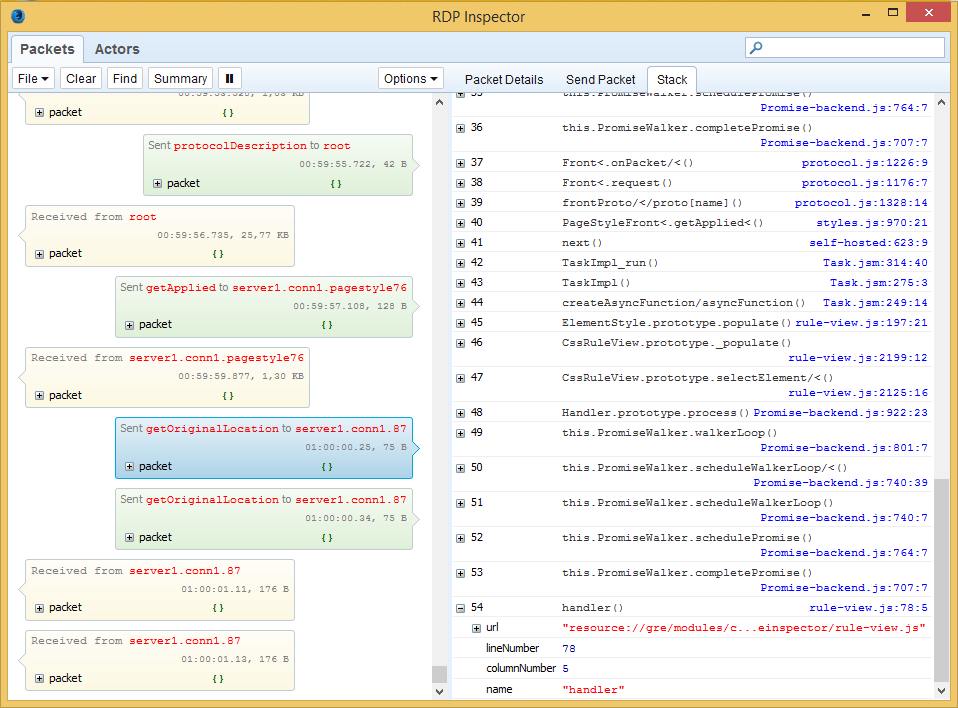
Clicking the filename opens it a new View Source window.
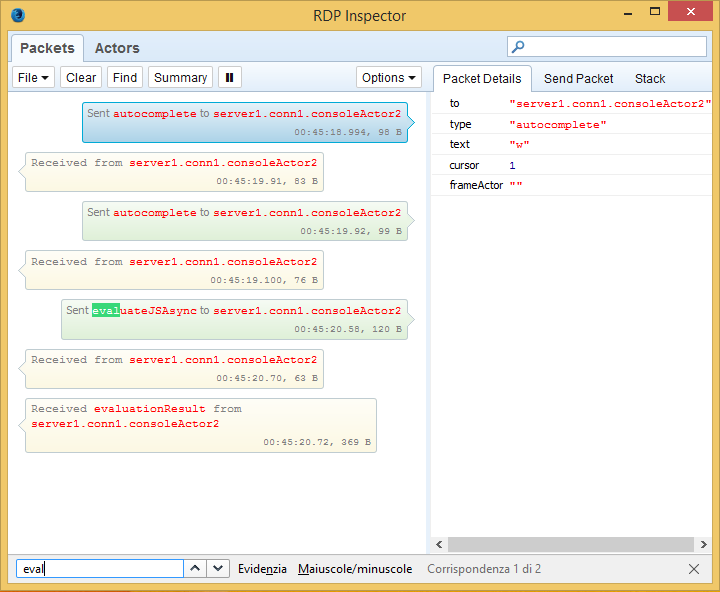
Search in the packet list is also supported. Pressing the Find button in the toolbar opens standard browser search bar. See the following screenshot:
This feature allows sending a custom packet to the debugger server. All you need to do is selecting the Send Packet side panel create packet properties and press the Send button.
In order to create a new packet property click on 'New...' (yellow) line at the top of the panel and type its name.
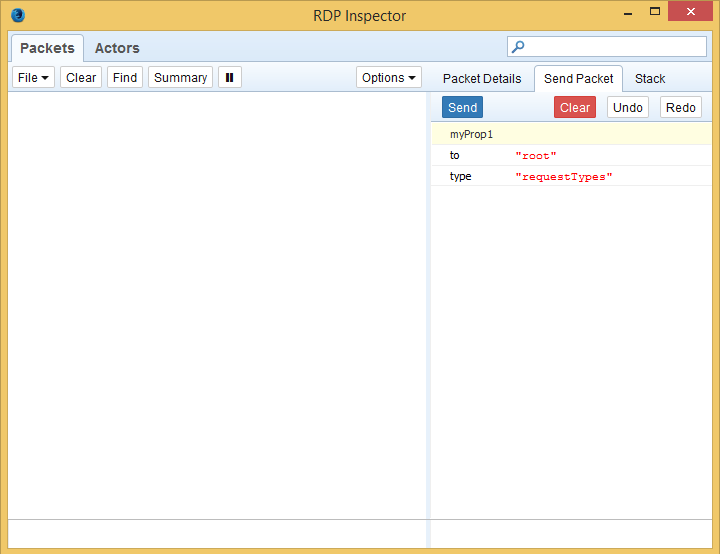
As soon as you press the Enter key the property is inserted at the end of the list.
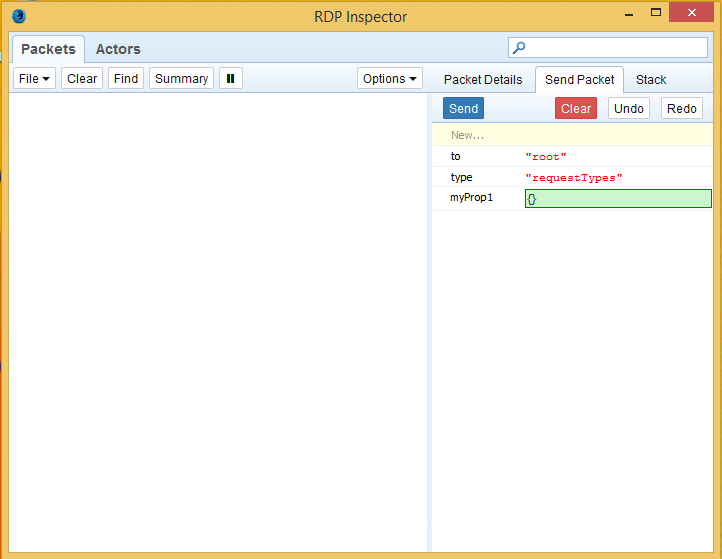
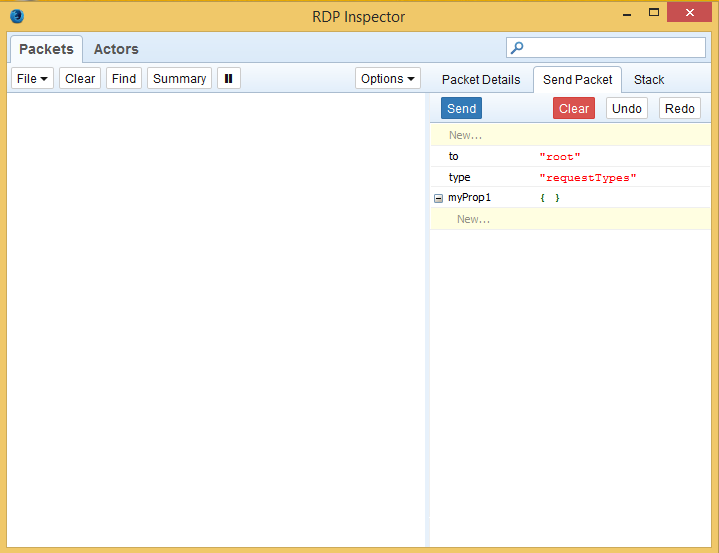
The default value is set to undefined and you can change it by clicking at the value text. Strings need to be inserted within quotes and new objects (JSON packet sub tree) can be crated by typing {} into the value input box.
When the packet is ready press the Send button and check out new packets displayed in the list.
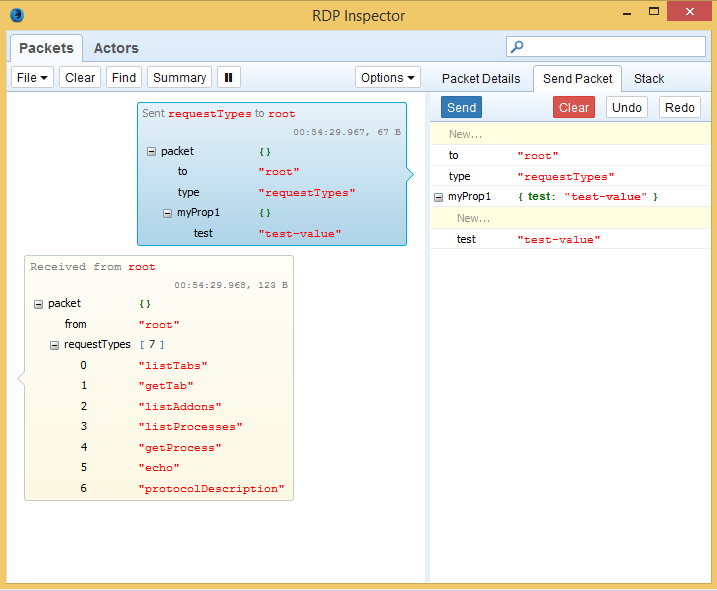
The screenshot above shows that our test properties has been sent. You can also see the response from the debugger server.
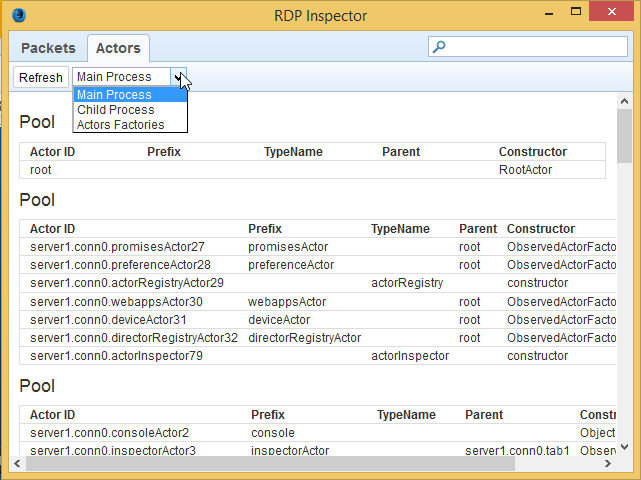
This feature allows inspecting registered actors on the debugger server.
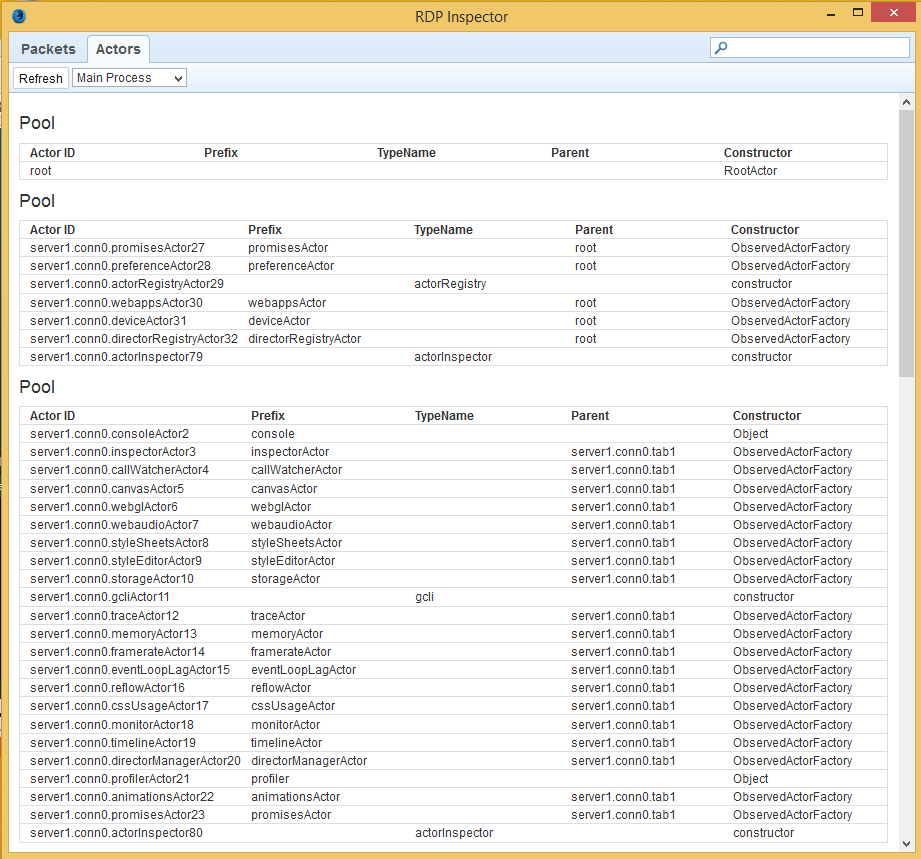
The Actors panel can be switched from Main process to Child Process or Actors Factories views using the select menu located in the panel toolbar:
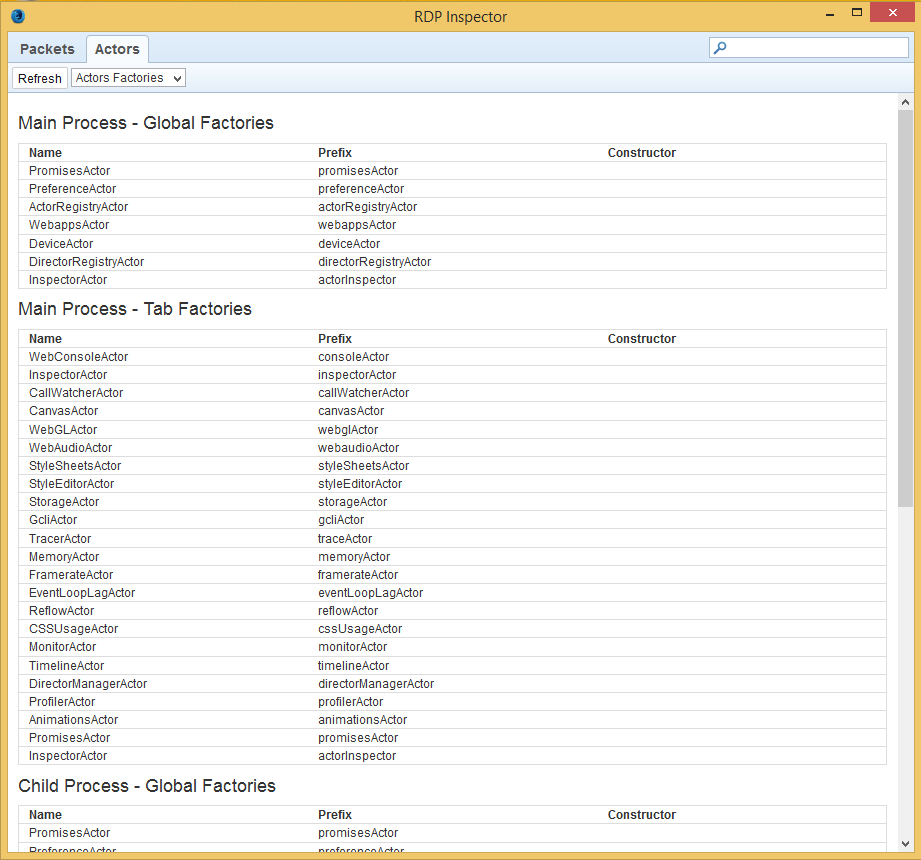
The Actors Factories view shows which Actor class creates actors with a defined prefix:
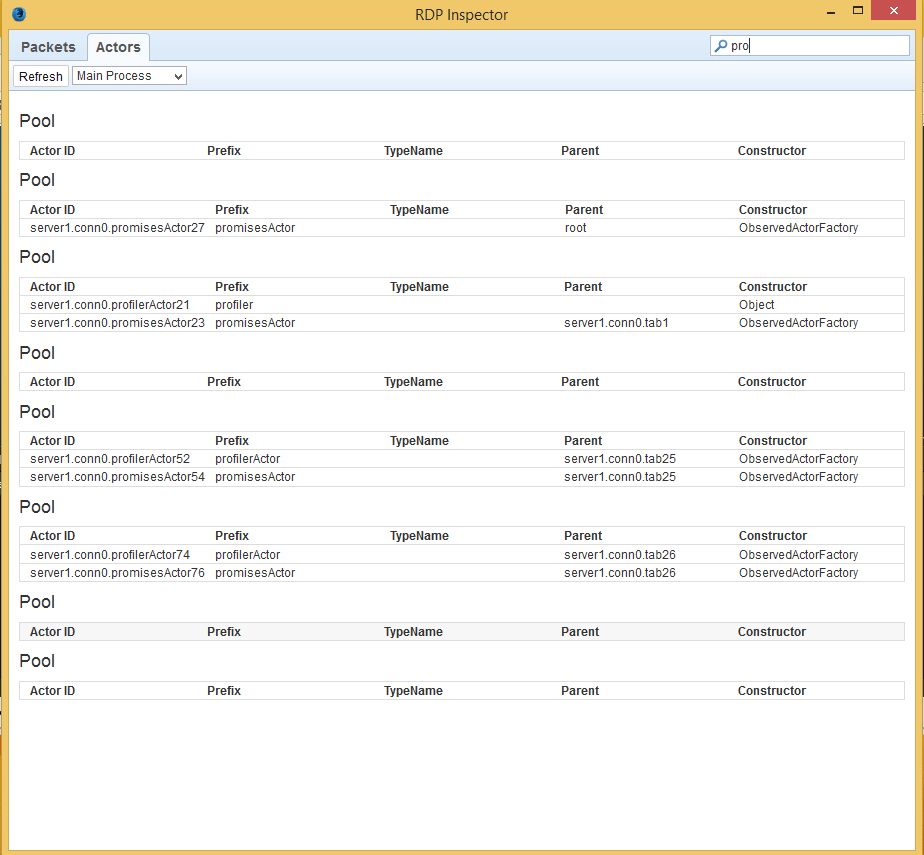
All the Actors panel's views an be easily filtered by typing into a Search Box located at the top right corner of the console window:
(in-progress) This feature, once enabled from the addon preference or from the start button popup menu, allows monitoring of the RDP connections created from the WebIDE:
Current Limitations:
- auto-open an RDP Inspector window everytime the WebIDE creates an RDP connection
- currently only one RDP Inspector window can be opened at any times