flashfmZoom: a tool for joint fine-mapping and exploration of GWAS results in the UK Biobank.
Please Note: If you want to use this tool locally, the latest Version-2023-March-21 requires a few pre-loaded large datasets (i.e.: approx. 2GB), therefore we saved all source code and datasets in this publicly available online Google Drive for users to download easily. Users just need download the whole folders into their local machines and run the app.R script (i.e.: Rshiny file) on the RStudio.
Accompanying paper:
flashfmZoom: a tool for joint fine-mapping and exploration of GWAS results in the UK Biobank
Feng Zhou, Colin Starr, Adam S Butterworth, Jennifer L Asimit
The preprint/paper can be downloaded: https://doi.org/10.1101/2023.03.21.533700
For a detailed user instruction: online supplementary material
For a quick YouTube demo: flashfmZoom on YouTube
For a step-by-step installation: flashfmZoom_installation_GitHub
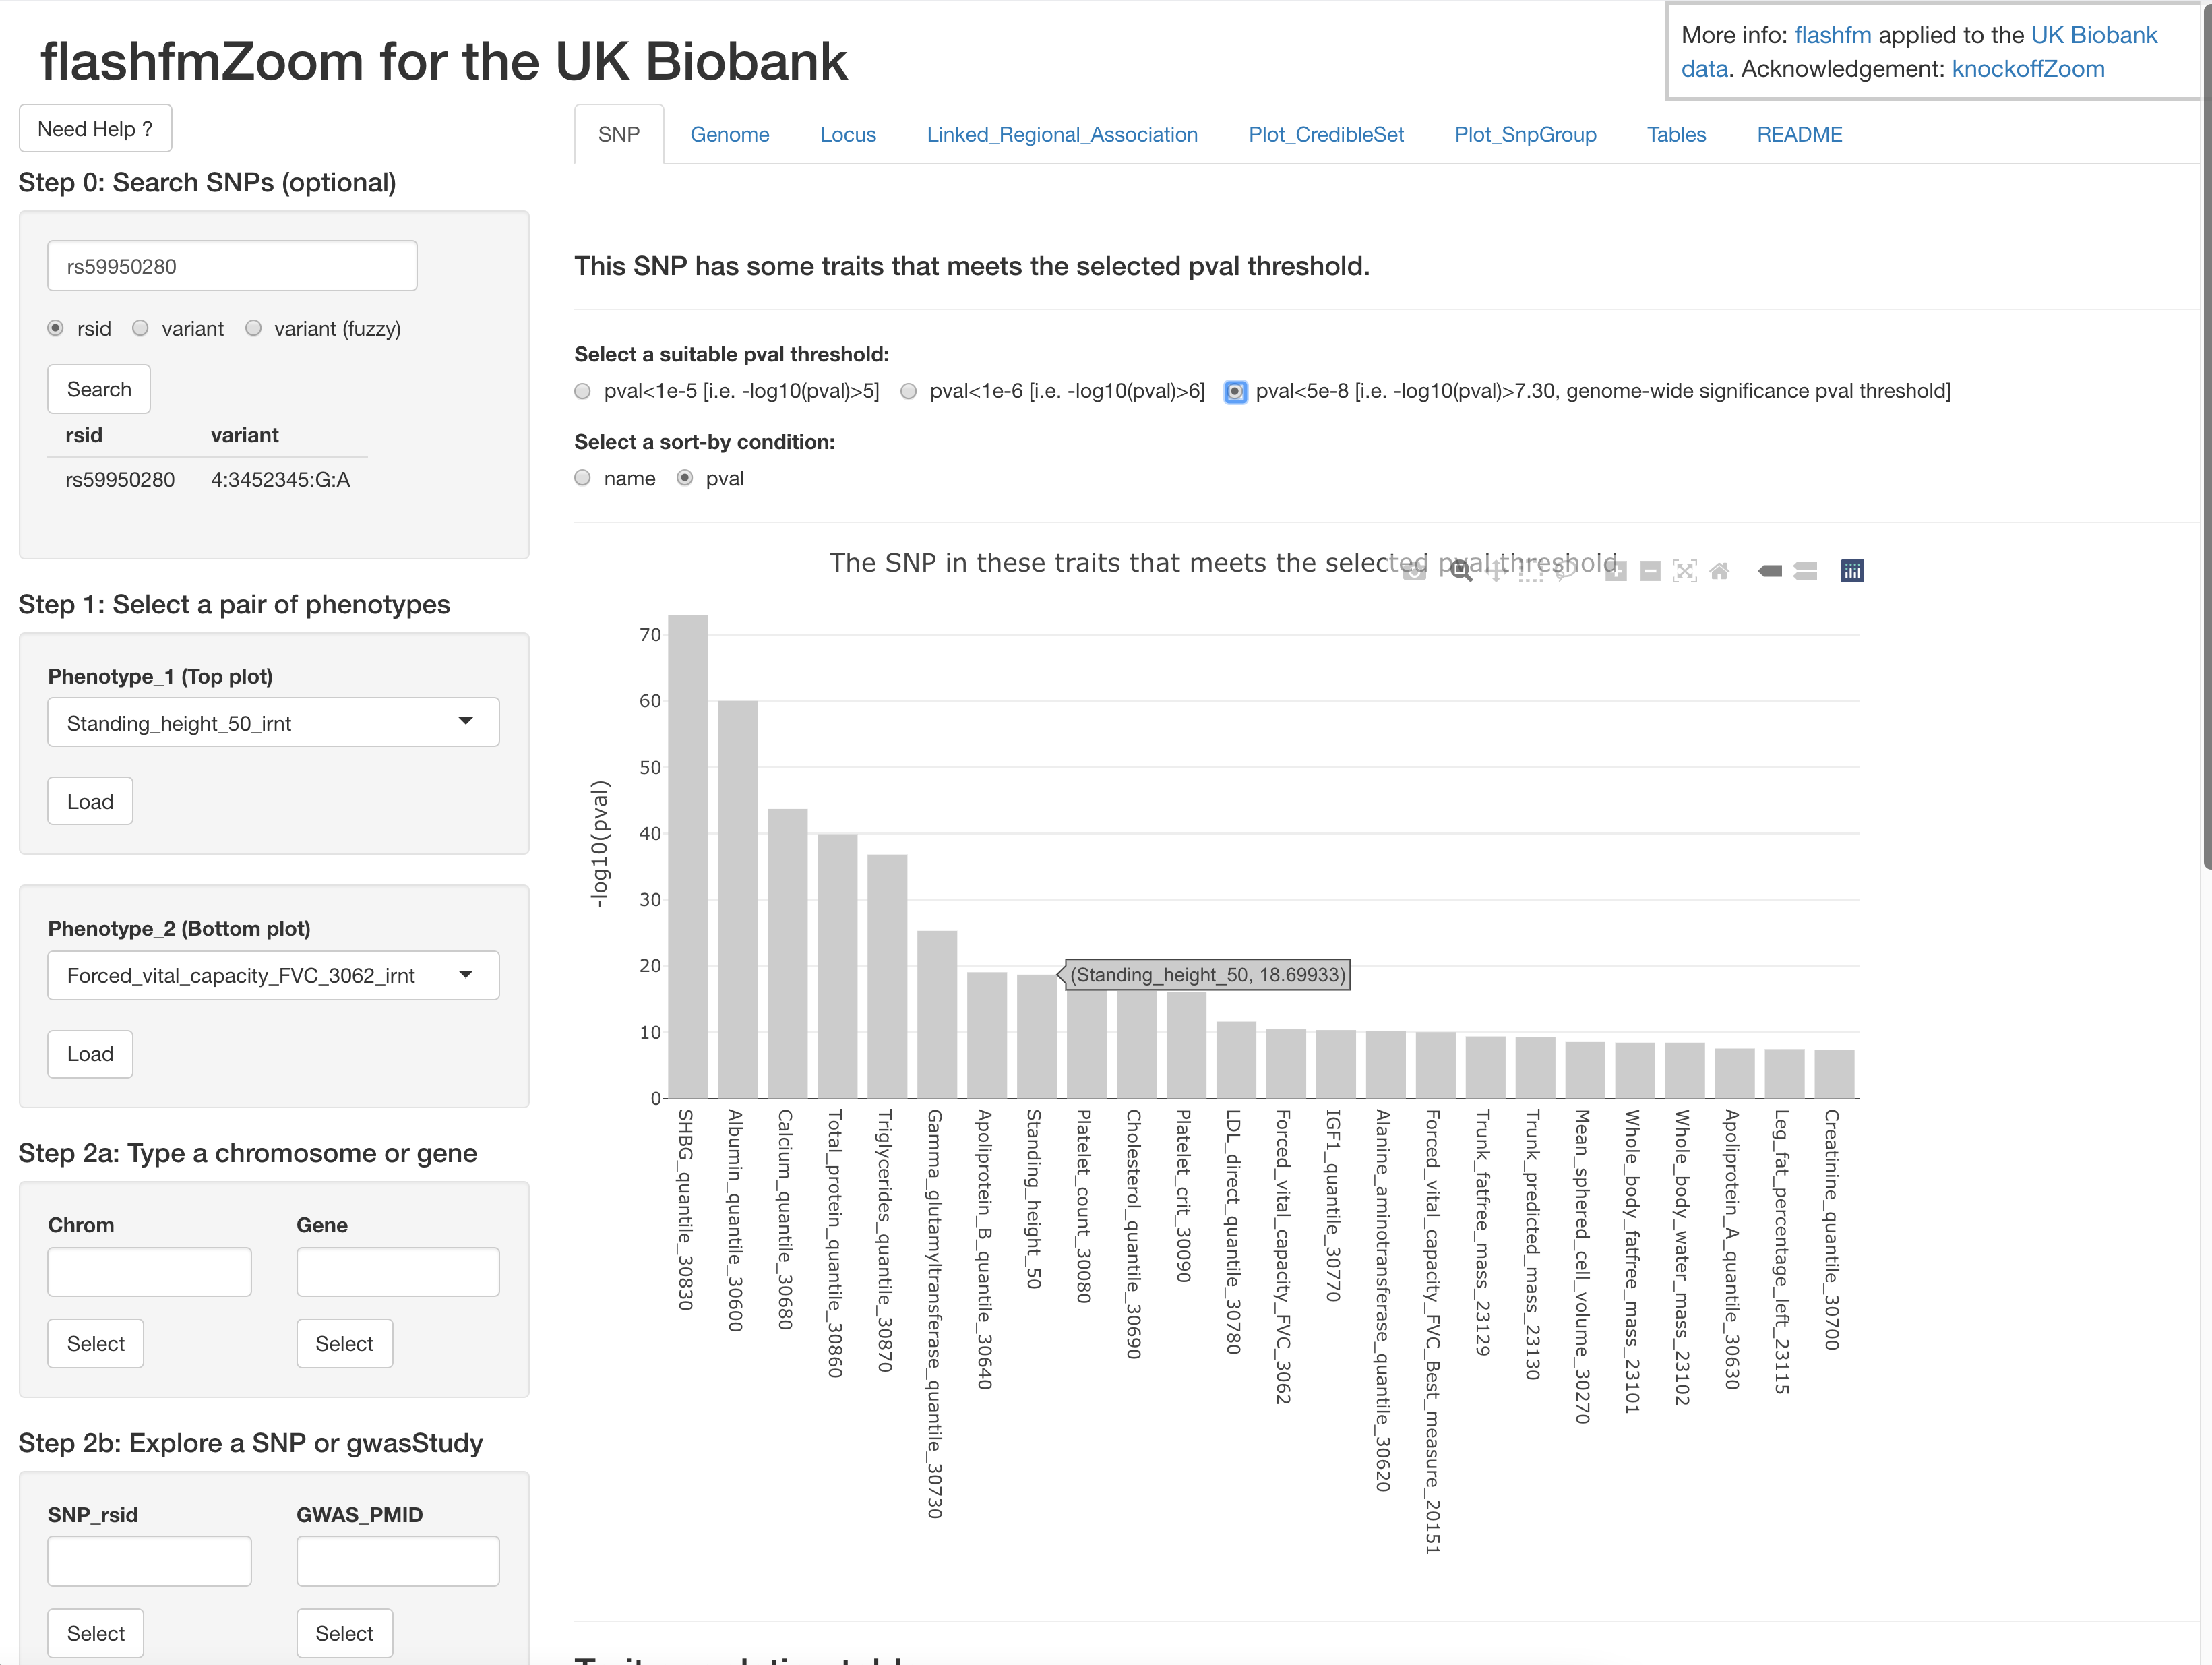
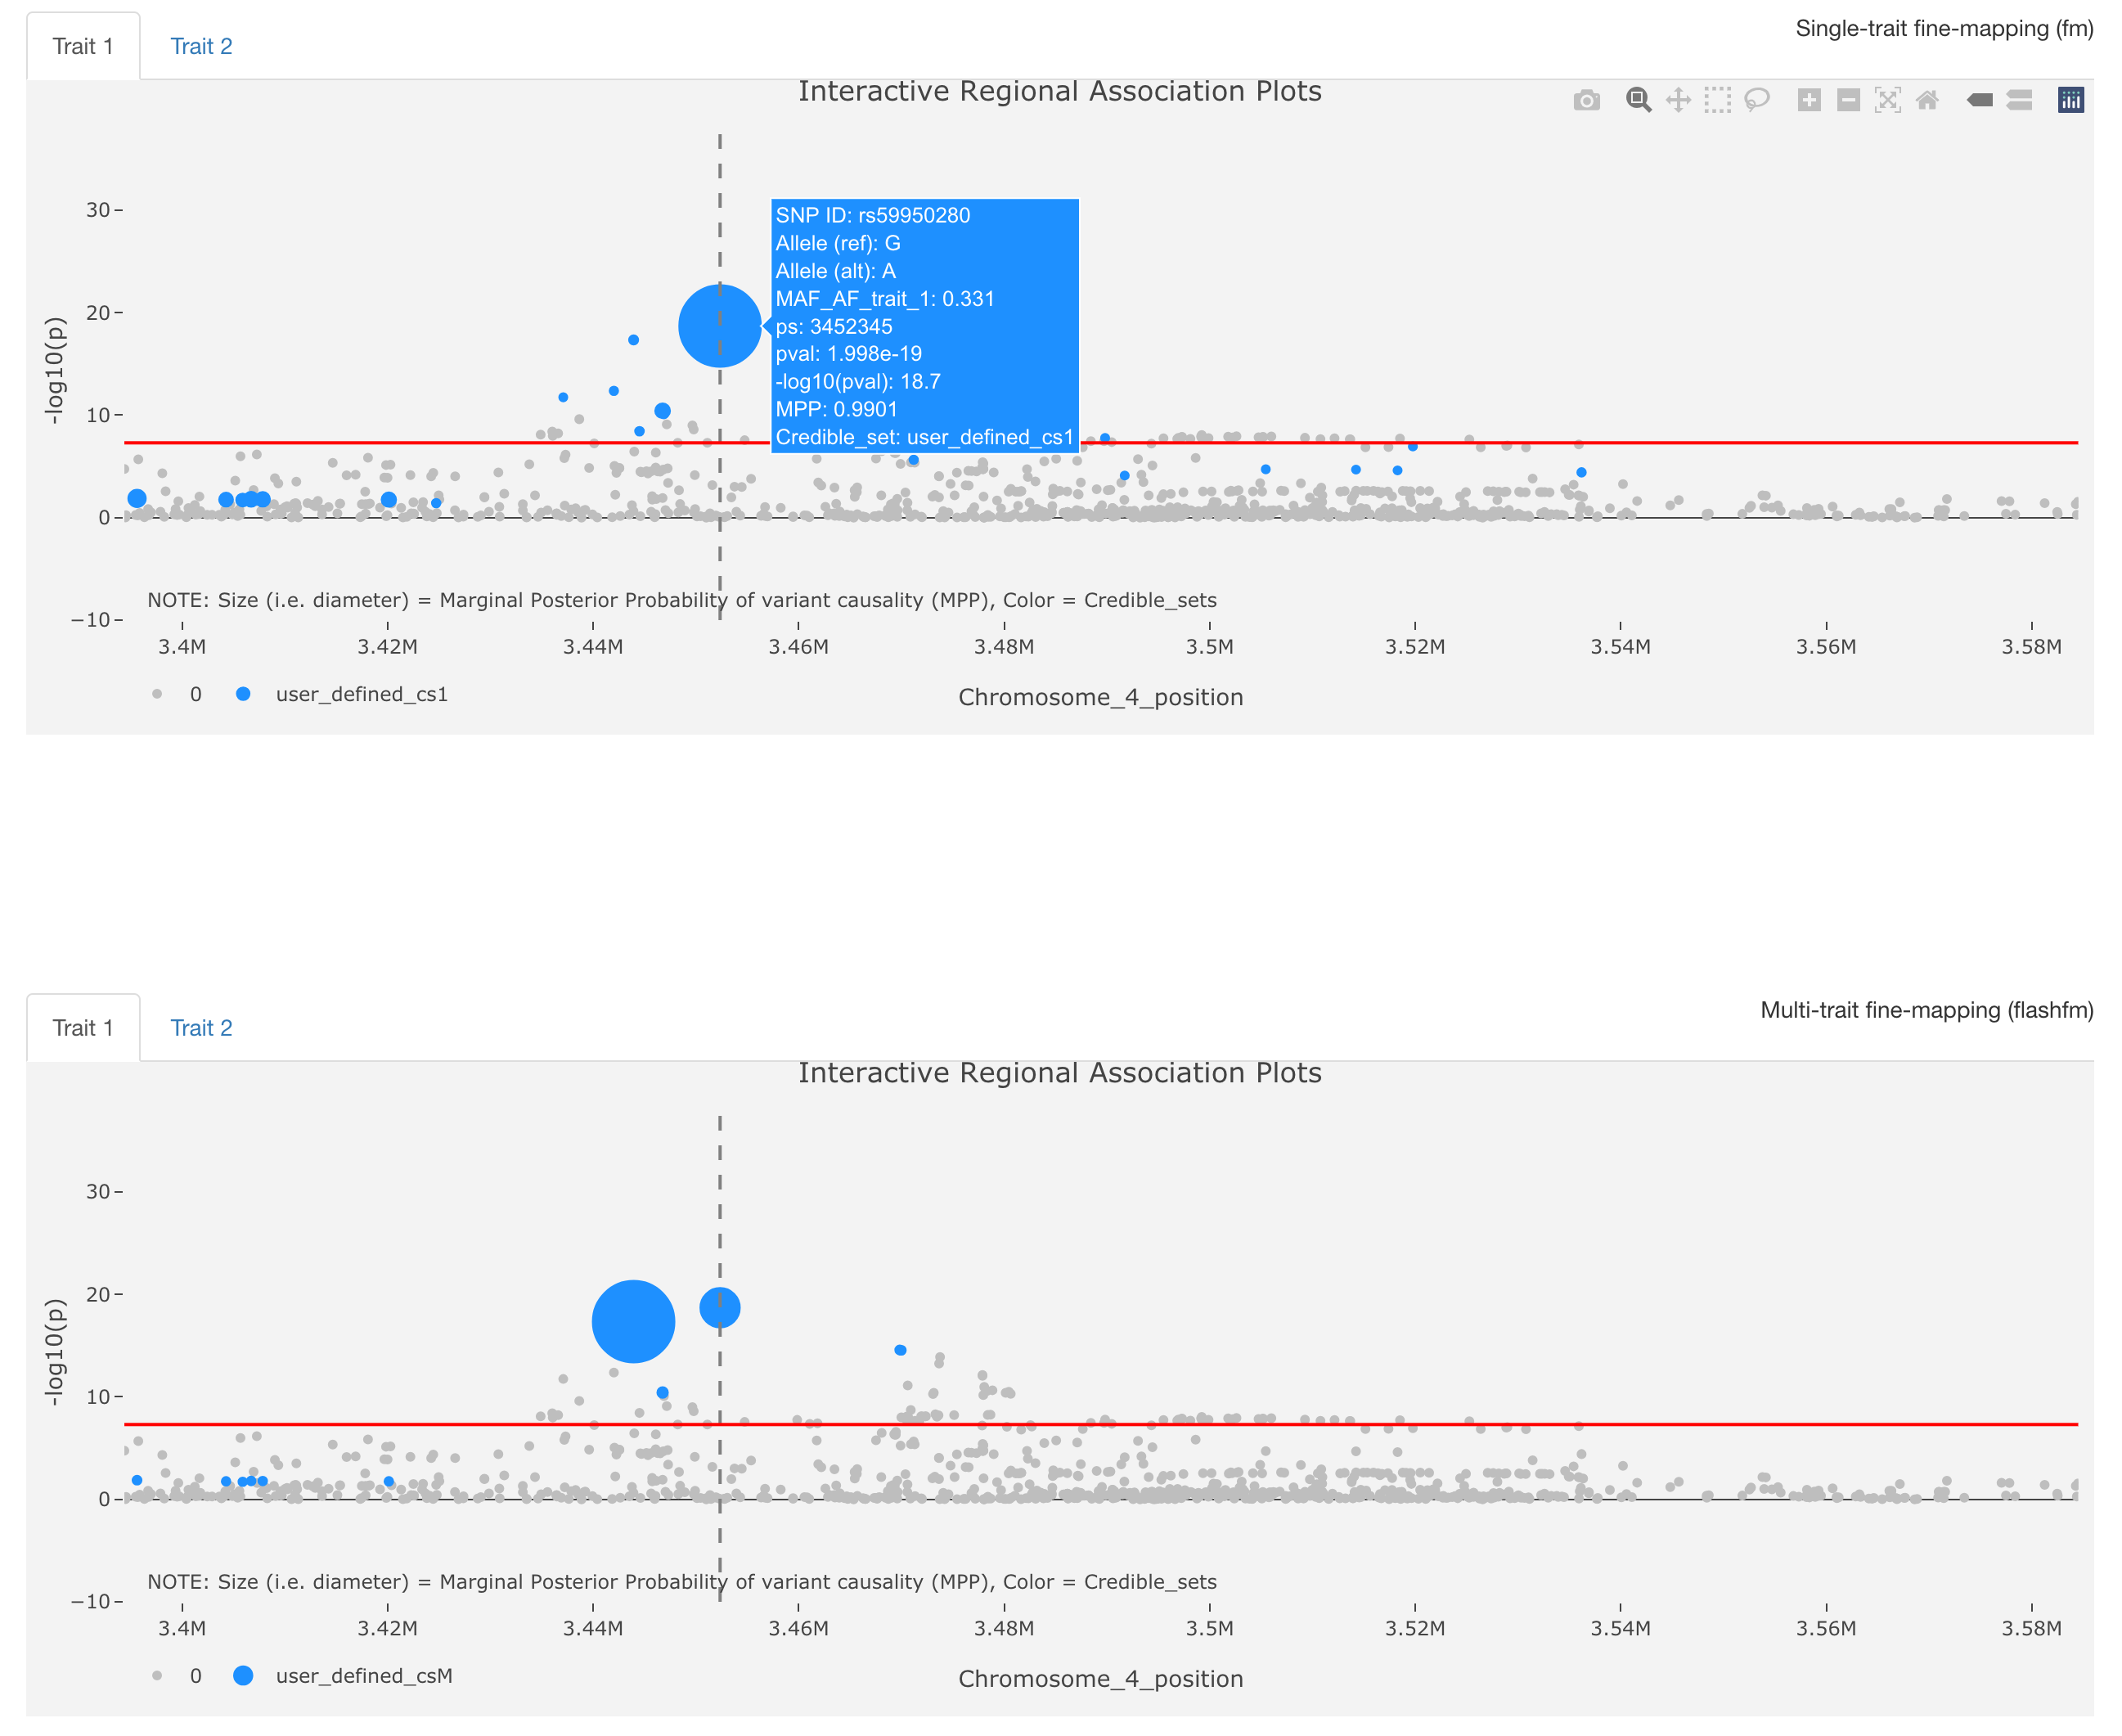
flashfmZoom is an all-in-one tool for analysis and interactive visualisation of potential causal genetic variants that underlie associations with quantitative traits from the UK Biobank. It offers a user-friendly interface and guides users in the selection of pleiotropic regions among subsets of 134 quantitative traits, such as cardiometabolic, hematologic, and respiratory traits. Users may then run single-trait fine-mapping, allowing for multiple causal variants, and leverage information between the traits using multi-trait fine-mapping to improve resolution. A series of interactive plots and downloadable tables are generated within flashfmZoom to identify potential causal variants that are shared or distinct between the traits; it also lists relevant literature for the traits and/or variants. Besides exploring traits that are well-known to be related, flashfmZoom encourages interactive exploration for the joint analysis of traits that may not often be considered together. This may reveal common aetiological pathways between traits related to different disorders.

There are three different ways/options of using this tool: online, cloud or local. This section explains pros and cons, as well as the implementation steps of each option. The online version is the most convenient option for users to experience and interact with this tool, but some features may not function due to the limit of real-time RAM memory size (i.e. with a maximum of 8GB) in Shinyapps.io (particularly when many online users open and run the interactive website at the same time). The cloud version increases the limit of memory size to a maximum of 16GB, but it requires users to login the Posit/RStudio Cloud by signing up a free account (still a quite simple process). Finally, the local version allows users to install the tool on their local machines to avoid possible memory limits, but it requires users to follow some extra steps of installing the related R packages.
- Online Web-based Version (ideally, as a quick demo)
- Simply play and explore this interactive web https://mrc-bsu.shinyapps.io/flashfmZoomOnline/
- Please note: Some features may not function due to the limit of real-time RAM memory size (i.e. with a maximum of 8GB) in Shinyapps.io (particularly when many online users open the interactive website at the same time).
- Please keep reloading or refreshing the page, if it does not show the content after waiting 1-2 minutes.
- RStudio/Posit Cloud Version (ideally, for a new user without R programming)
- Users can sign up a Posit Cloud free account and login the flashfmZoom workspace via a shared link (at this moment, please email feng.zhou@mrc-bsu.cam.ac.uk for the shared link).
- The limit of RAM memory size is increased to a maximum of 16GB for all users, therefore there will be no issue.
- Read this detailed instruction to open and run the flashfmZoom in the cloud, each user has an individual space and will not affect other users.
- Local Machine Version
- MacOS: download flashfmZoomLocal_MacOS.zip and follow the detailed step-by-step installation.
- Linux/Unix: download flashfmZoomLocal_Unix.zip and follow the detailed installation.
- Please note, Windows may have some limitations of using flashfmZoom, such as: (1) It cannot run a multi-core process of flashfm function in Windows; (2) It cannot use the option of FLASHFMwithFINEMAP, since FINEMAP software may not run on the Windows directly. Therefore, please email feng.zhou@mrc-bsu.cam.ac.uk if you need install Windows/PC version.


- Jennifer Asimit (University of Cambridge)
- Adam Butterworth (University of Cambridge)
- Colin Starr (University of Cambridge)
- Feng Zhou (University of Cambridge)
We would like to thank the authors of KnockoffZoom (Sesia et al., 2020, 2021), echolocatoR (Schilder et al., 2020) and LocusZoom (Pruim et al., 2010; Boughton et al., 2020), as their clear software documentation and coding implementations were a key ingredient in the development of flashfmZoom.
The datasets used in the package can be found in this linked Google Drive. Other external data sources: (1) UK Biobank GWAS summary statistics: http://www.nealelab.is/uk-biobank and https://github.com/Nealelab/UK_Biobank_GWAS; (2) 1000 Genomes European super-population data to approximate LD matrices: https://ctg.cncr.nl/software/MAGMA/ref_data/; (3) Trait correlation between traits in the UK Biobank: https://ukbb-rg.hail.is or the associated data in Supplementary Materials (Bulik-Sullivan et al., 2015) https://www.ncbi.nlm.nih.gov/pmc/articles/PMC4797329/#sd2; (4) GWAS publications from GWASATLAS https://atlas.ctglab.nl (Watanabe et al., 2019); (5) Gene positions file ncbiRefSeq.txt https://www.ncbi.nlm.nih.gov/refseq/ (O'Leary et al., 2016); (6) Variant annotations (ENCODE Project Consortium, 2012) file wgEncodeBroadHmmGm12878HMM.txt from http://hgdownload.cse.ucsc.edu/goldenpath/hg19/encodeDCC/wgEncodeBroadHmm/
FINEMAP: efficient variable selection using summary data from genome-wide association studies.
Benner, C., Spencer, C. C., Havulinna, A. S., Salomaa, V., Ripatti, S., & Pirinen, M. (2016).
Bioinformatics, 32(10), 1493-1501. https://doi.org/10.1093/bioinformatics/btw018.
LocusZoom.js: interactive and embeddable visualization of genetic association study results.
Boughton, A. P., Welch, R. P., Flickinger, M., VandeHaar, P., Taliun, D., Abecasis, G. R., & Boehnke, M. (2021).
Bioinformatics, 37(18), 3017-3018. https://doi.org/10.1093/bioinformatics/btab186.
An atlas of genetic correlations across human diseases and traits.
Bulik-Sullivan, B., Finucane, H. K., Anttila, V., Gusev, A., Day, F. R., Loh, P. R., ... & Neale, B. M. (2015).
Nature genetics, 47(11), 1236-1241. https://www.nature.com/articles/ng.3406.
ENCODE Project Consortium. (2012).
An integrated encyclopedia of DNA elements in the human genome.
Nature. Sep 6;489(7414):57-74. https://www.nature.com/articles/nature11247.
The flashfm approach for fine-mapping multiple quantitative traits.
Hernandez, N., Soenksen, J., Newcombe, P., Sandhu, M., Barroso, I., Wallace, C., Asimit, J.L. (2021).
Nature communications, 12, 6147. https://doi.org/10.1038/s41467-021-26364-y.
Fine-mapping genetic associations.
Hutchinson, A., Asimit, J., Wallace, C. (2020).
Human Molecular Genetics, 29(R1), 81–88. https://doi.org/10.1093/hmg/ddaa148.
JAM: a scalable Bayesian framework for joint analysis of marginal SNP effects.
Newcombe, P. J., Conti, D. V. & Richardson, S. (2016).
Genet. Epidemiol. 40, 188–201. https://doi.org/10.1002/gepi.21953.
Reference sequence (Ref-Seq) database at NCBI: current status, taxonomic expansion, and functional annotation.
O'Leary, N. A., Wright, M. W., Brister, J. R., Ciufo, S., Haddad, D., McVeigh, R., ... & Pruitt, K. D. (2016).
Nucleic acids research, 44(D1), D733-D745. https://doi.org/10.1093/nar/gkv1189.
LocusZoom: regional visualization of genome-wide association scan results.
Pruim, R. J., Welch, R. P., Sanna, S., Teslovich, T. M., Chines, P. S., Gliedt, T. P., ... & Willer, C. J. (2010).
Bioinformatics, 26(18), 2336-2337. https://doi.org/10.1093/bioinformatics/btq419.
echolocatoR: an automated end-to-end statistical and functional genomic fine-mapping pipeline.
Schilder, B. M., Humphrey, J., & Raj, T. (2021).
Bioinformatics, 38(2), 536–539. https://doi.org/10.1093/bioinformatics/btab658.
Multi-resolution localization of causal variants across the genome.
Sesia, M., Katsevich, E., Bates, S., Candès, E., & Sabatti, C. (2020).
Nature communications, 11(1), 1-10. https://www.nature.com/articles/s41467-020-14791-2.
False discovery rate control in genome-wide association studies with population structure.
Sesia, M., Bates, S., Candès, E., Marchini, J., & Sabatti, C. (2021).
PNAS, 118(40), e2105841118. https://doi.org/10.1073/pnas.2105841118.
A global overview of pleiotropy and genetic architecture in complex traits.
Watanabe, K., Stringer, S., Frei, O. et al. (2019).
Nature genetics, 51, 1339–1348. https://www.nature.com/articles/s41588-019-0481-0.
flashfm-ivis: interactive visualisation for fine-mapping of multiple quantitative traits.
Zhou, F., Butterworth, A. S., & Asimit, J. L. (2022).
Bioinformatics, 38(17), 4238–4242. https://doi.org/10.1093/bioinformatics/btac453.