Cubism integration
Cubism is a time series visualization library http://square.github.io/cubism/. It is basically a heat map of time series data.
Cubism integration was introduced in Ganglia Web version 3.7.0. It allows you to create adhoc Cubism dashboards. To use it click on the Cubism tab in the UI. You will need to supply following
- Host Regular expression - specify a regular expression that will match hosts you want e.g. web[0-4] matches hosts that start with web0, web1, web2, web3 and web4
- Metric Regular expression - specify a regular expression that will match only metrics you want
- Min and Max - these are minimum and maximum values for the time series you are trying to analyze. It may be trial and error. You may want to set it to absolute max value or if you don't care for e.g. spikes something a lot less than that. For example below I am using max TCP retransmission percentage of 2%.
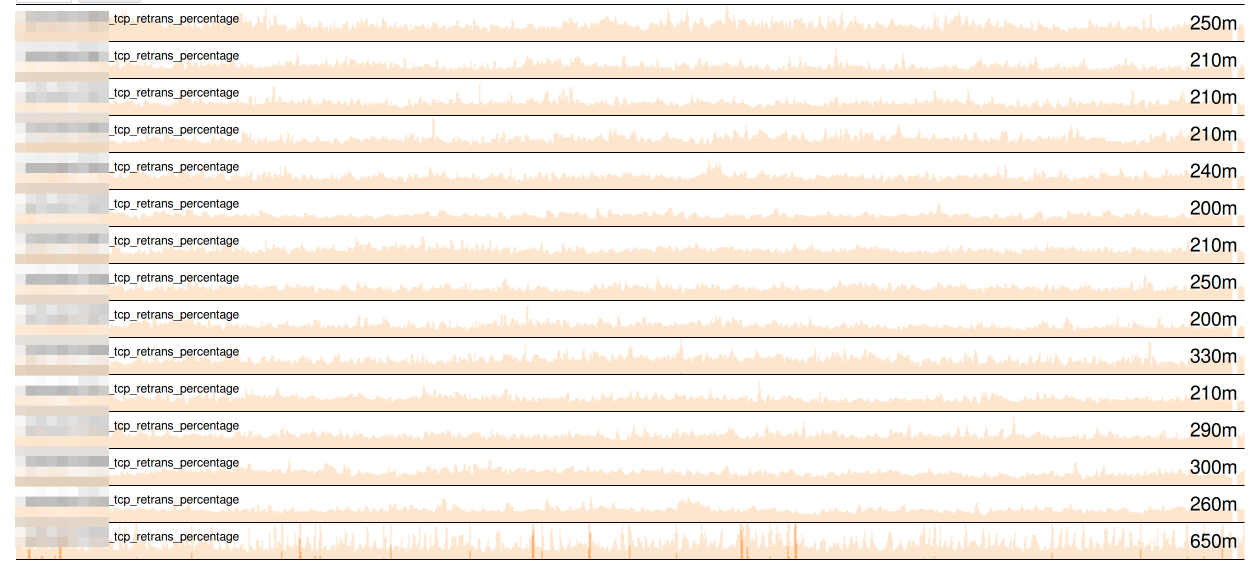
It appears last server may be behaving differently than all the other ones however if I change the max to 1%
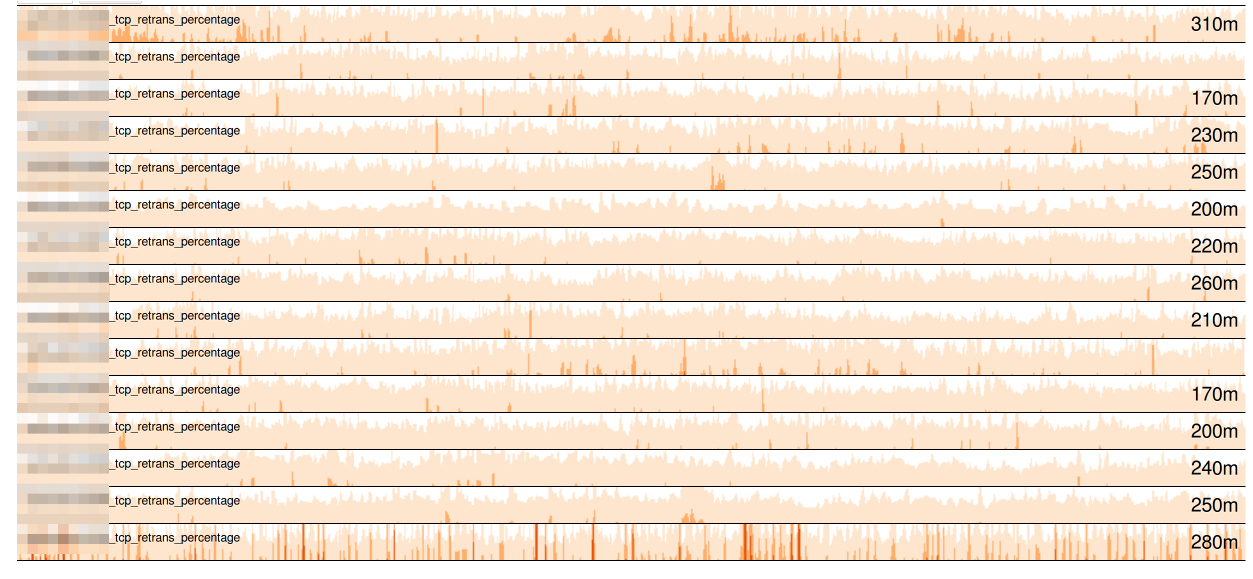
I can see that first server may also be problematic.
Variables that can be overridden in conf.php are following
$conf['cubism_js_path'] = "https://cdnjs.cloudflare.com/ajax/libs/cubism/1.6.0/cubism.v1.min.js";
Defines path to cubism JS library. By default it uses the CDNJS to serve the file. You can use a relative path if you download it and place it into your Ganglia tree.
$conf['cubism_d3_path'] = "https://cdnjs.cloudflare.com/ajax/libs/d3/3.5.5/d3.min.js";
Defines path to D3 JS library. By default it uses the CDNJS to serve the file. You can use a relative path if you download it.
$conf['cubism_default_height'] = 30;
This is the default height of Cubism series graphs.
$conf['cubism_default_step'] = 15;
This is the time step between different data points. It should be set to your gmetads polling period. Gmetad's polling period is 15 seconds. Using the 15 second period will show about last 5 hours worth data points. You could try to use multiples of 15 seconds. If graph ends up lacking data points try adjusting the multiple
If you are using a reverse proxy such as Varnish or Apache proxy requested URL may not derive correctly. This allows you to set it your Ganglia instance.
# Set this if you are fronted by a proxy and that ends up messing with Cubism URL detection
#$conf['ganglia_url_prefix'] = "https://metric.domain.com";
#$conf['ganglia_url_suffix'] = "/ganglia";