Modeling the dimensions of MLB stadiums using matplotlib
Here is a list of piecewise functions created by Fangraphs user Andrew Fox where each subfunction describes the distance of the outfield wall of an mlb stadium from an angle θ1 to another angle θ2 relative to the leftfield foul pole.
There are 3 different formats to these subfunctions which are as follows:

Knowing these formats allowed me to simply (yet tediously!) collect the constants used in each subequation into a tuple, append each tuple to a list for each park's piecewise function, and parse through each piecewise to plot the outfield walls of each stadium using matplotlib's polar plot function. The following plot shows 28 of the current 30 MLB parks overlayed on one another. The radial axis represents the distance of the outfield wall from homeplate in feet.

Using data from Andrew Clem's extensive database of stadium data, I was able to use the same methodology to plot the heights of the same 28 outfield walls. Having this data will allow me to model each park in 3 dimensions.

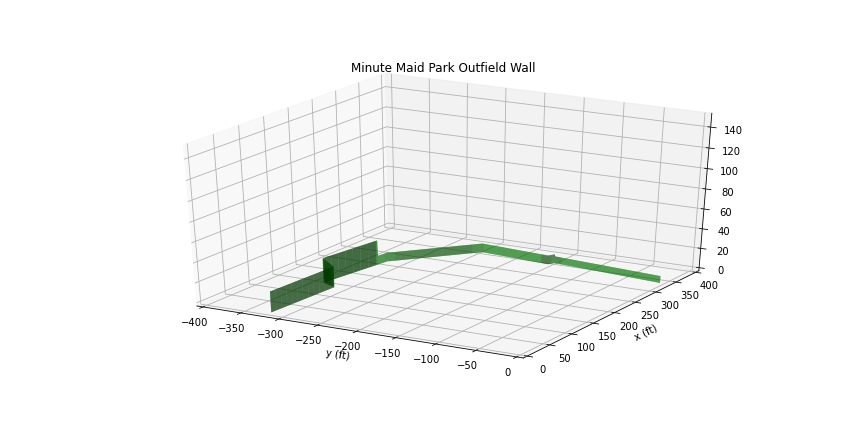
Using matplotlib's plot_surface function, I was able to convert these wall distances and heights into 3D surfaces. This requires 3 arrays of shape 901x901 to represent each of the lower and upper bounds of each dimension. (Please see code for more information)
First, was a list P (for greek letter phi) of 901 evenly spaced angles between 0 and π/2 repeated 901 times.
Next, was a list R of 901 values evenly spaced from 0 to the radial distance of the outfield wall at each of the 901 evenly spaced angles between 0 and π/2.
Lastly, was a list z of 901 values evenly spaced from 0 to the height of the outfield wall at each of the 901 evenly spaced angles between 0 and π/2.
Once this data was compiled into 3 arrays, I converted the data from arrays R and P from polar to cartesian coordinates to plot the final surface.
ARZ

BAL

BOS

CHC

CWS

CIN

CLE

COL

DET

HOU
KC

LAA

LAD

MIA

MIL

MIN

NYM

NYY

OAK

PHI

PIT

SDP

SFG

SEA

STL

TB

TOR

WSN

Conclusion: The RF Short Porch in Yankee Stadium (315' deep, 8' tall) is much easier to hit a ball over than the Green Monster (310' deep, 37' tall) so I never want to hear Yanks fans (dad) talk trash about Fenway's dimensions again.