![]()
Fitting for Psychometric curves in Python and Matlab. Supports:
- Simple logit link function (mean and varience parameters).
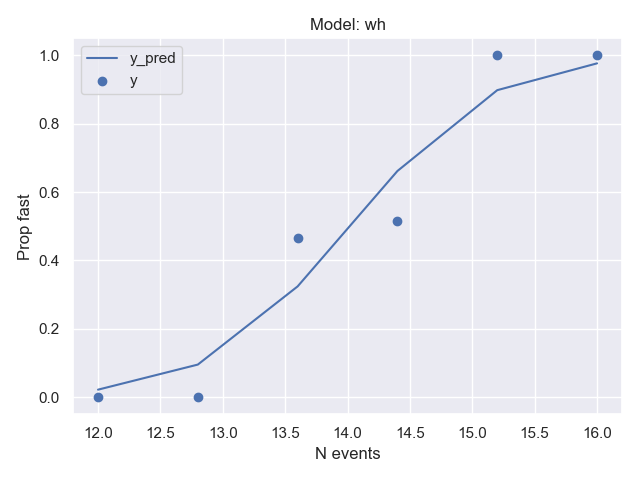
- Wichmann and Hill 2001. This curve adds two additional parameters, "guess" and "lapse", which control somewhat for subject fallibility, improving the estimate of the discrimination threshold.
pip install fitpsycheimport numpy as np
from fit_psyche.psychometric_curve import PsychometricCurve
x = np.linspace(start=12, stop=16, num=6)
y = (x > x.mean()).astype(float)
y[2] = y[2] + np.abs(np.random.rand())
y[3] = y[3] - np.abs(np.random.rand())
pc = PsychometricCurve(model='wh').fit(x, y)
pc.plot(x, y)
print(pc.score(x, y))
print(pc.coefs_)>>> 0.9796769364413764
>>> {'mean': 13.829364486404069,
'var': 0.9658606821413274,
'guess_rate': 0.010000000000000002,
'lapse_rate': 0.010000000000000002}
Assuming enough data is available, this is also compatible with CV search objects, for example:
import numpy as np

from sklearn.model_selection import RandomizedSearchCV

from fit_psyche.psychometric_curve import PsychometricCurve

x = np.linspace(start=12, stop=16, num=16)
y = (x > x.mean()).astype(float)
y[2] = y[2] + np.abs(np.random.rand())
y[3] = y[3] - np.abs(np.random.rand())

grid = RandomizedSearchCV(PsychometricCurve(), n_jobs=3,
                          param_distributions={'model': ['wh', 'logit'],
                                               'guess_rate_lims': [(0.01, 0.05), (0.01, 0.03), (0.03, 0.04)],
                                               'lapse_rate_lims': [(0.01, 0.05), (0.01, 0.03), (0.03, 0.04)]})
grid.fit(x, y)

print(grid.best_estimator_.get_params())
print(grid.best_estimator_.coefs_)
>>> {'guess_rate_lims': (0.03, 0.04),
'lapse_rate_lims': (0.01, 0.05),
'mean_lims': (0, 20),
'model': 'wh',
'var_lims': (0.001, 20)}
>>> {'mean': 14.001413727640738,
'var': 0.027772082199237953,
'guess_rate': 0.030000000000000002,
'lapse_rate': 0.01000000000000001}
Fitting functions can be accessed by creating a PsychFit object, or directly. See also examples in scripts/.
% Make up some data
y1 = [0 0 25 25 50 50 75 75 100 100]/100;
y2 = [20 20 20 30 40 60 70 80 80 80];
y2 = (y2+rand(1,numel(y2))*5)/100;
% Create x axis
x = 0.1:0.1:1;ffit1 = fitPsyche(x, y1, 'GLM');
ffit2 = fitPsyche(x, y2, 'GLM');
figure
plotPsyche(ffit1)
hold on
plotPsyche(ffit2)
legend({'y1', 'y2', 'y1 fit', 'y2 fit'}, 'Location', 'NorthWest')
title('GLM fit')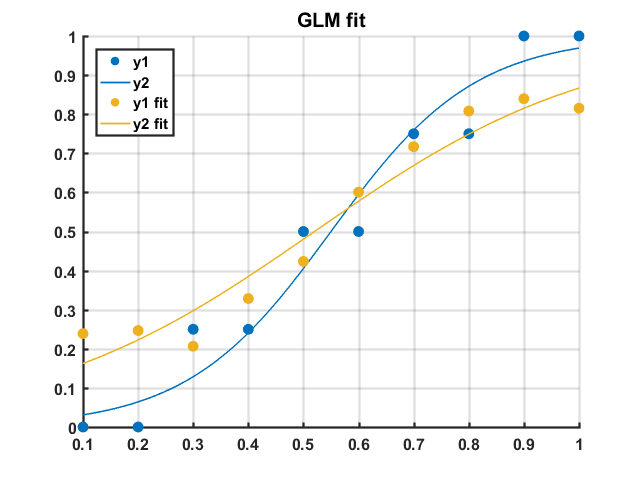
ffit1 = fitPsyche(x, y1, 'WH');
ffit2 = fitPsyche(x, y2, 'WH');

figure
plotPsyche(ffit1)
hold on
plotPsyche(ffit2)
legend({'y1', 'y2', 'y1 fit', 'y2 fit'}, 'Location', 'NorthWest')
title('WH 2001 fit')

disp(ffit1.model)
disp(ffit2.model)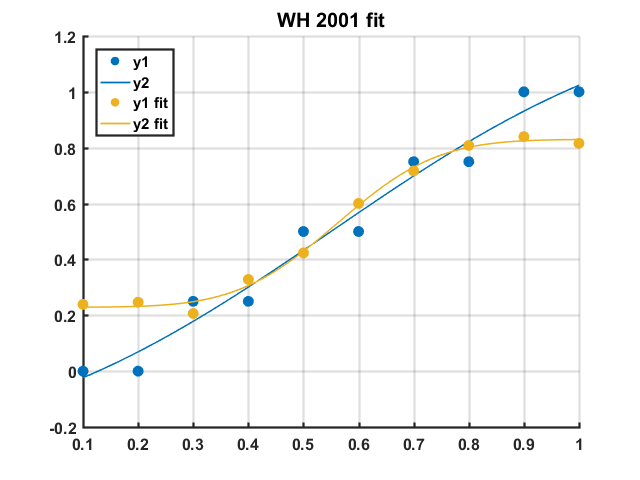
%% Set limits for WH fit

% g (guess rate), l (lapse), u (mean, bias), v (variance, discrimination
% thresh)
% UpperLimits:
UL = [0.05, 0.05, 1, 1]; % Limit upper bound of g and l to 5%
% StartPoints:
SP = [0, 0, 0.5, 0.5];
% LowerLimits:
LL = [0.05, 0.05, 0, 0];

ffit1 = fitPsyche(x, y2, 'WH', [UL;SP;LL]);
ffit2 = fitPsyche(x, y2, 'WH');
figure
plotPsyche(ffit1)
hold on
plotPsyche(ffit2)
legend({'y2', 'y2 limited fit', 'y2', 'y2 fit'}, 'Location', 'NorthWest')
title('WH 2001 fit')

disp(ffit1.model)
disp(ffit2.model)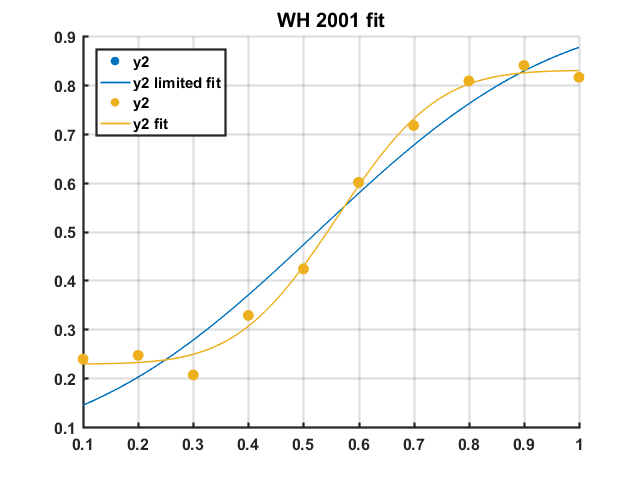
%% Fit GLM - access methods directly

[coeffs1, curve1, ~] = ...
    fitPsyche.fitPsycheCurveLogit(x, y1);
[coeffs2, curve2, ~] = ...
    fitPsyche.fitPsycheCurveLogit(x, y2);

% Plot
figure
scatter(x', y1')
hold on
scatter(x', y2')
plot(curve1(:,1),curve1(:,2))
plot(curve2(:,1),curve2(:,2))
legend({'y1', 'y2', 'y1 fit', 'y2 fit'}, 'Location', 'NorthWest')
title('GLM fit')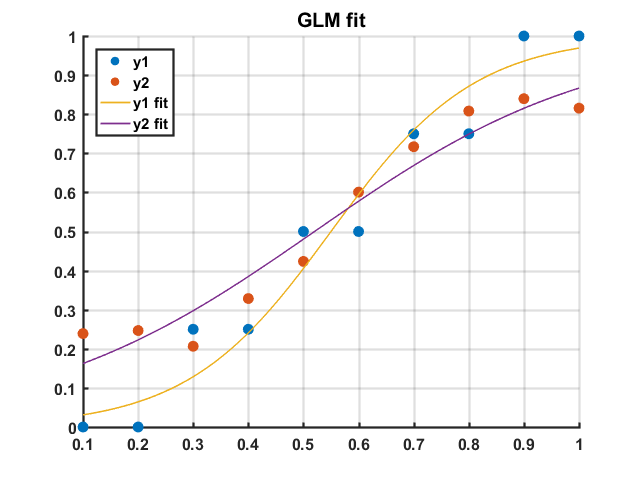
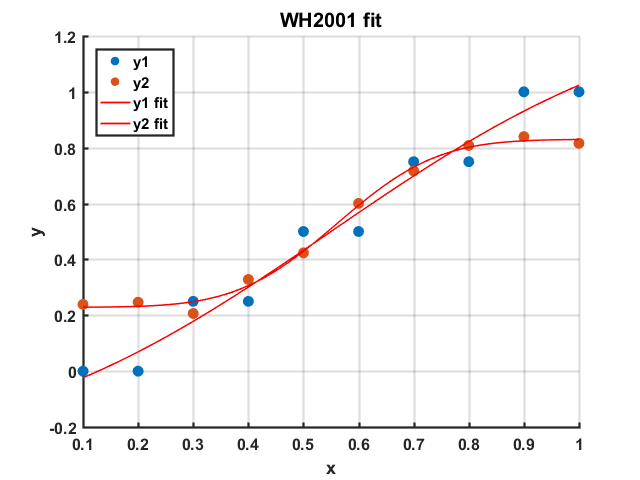
[ffit1, curve1] = ...
    fitPsyche.fitPsycheCurveWH(x, y1);
[ffit2, curve2] = ...
    fitPsyche.fitPsycheCurveWH(x, y2);

% Plot
figure
scatter(x', y1')
hold on
scatter(x', y2')
plot(ffit1)
plot(ffit2)
legend({'y1', 'y2', 'y1 fit', 'y2 fit'}, 'Location', 'NorthWest')
title('WH2001 fit')