Reproduce the optimize algorithm of EvoRiver
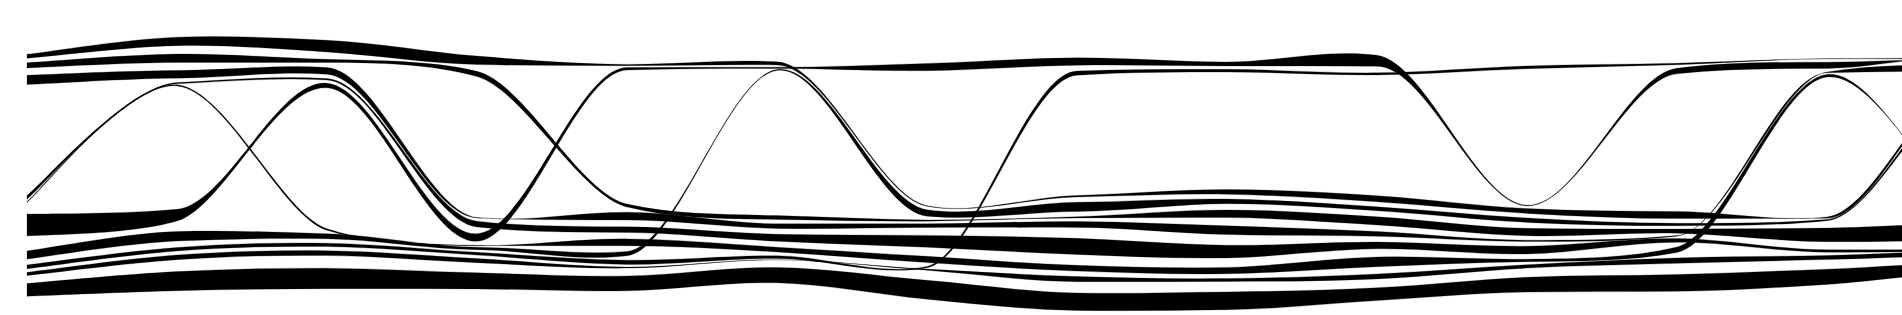
Once we want to show a state of something that changes over time, we may use stackmap, but if there are many things with a state mentioned before? In order to show multiple objects with timechanging state, we propose a method called “EvoRiver” which could reduce the crossover caused by state transitions and makes the graphics looks more symmetrical. The optimization we used is shown below,and mosek will help us to find solve, if you want to know more details, please see the paper.

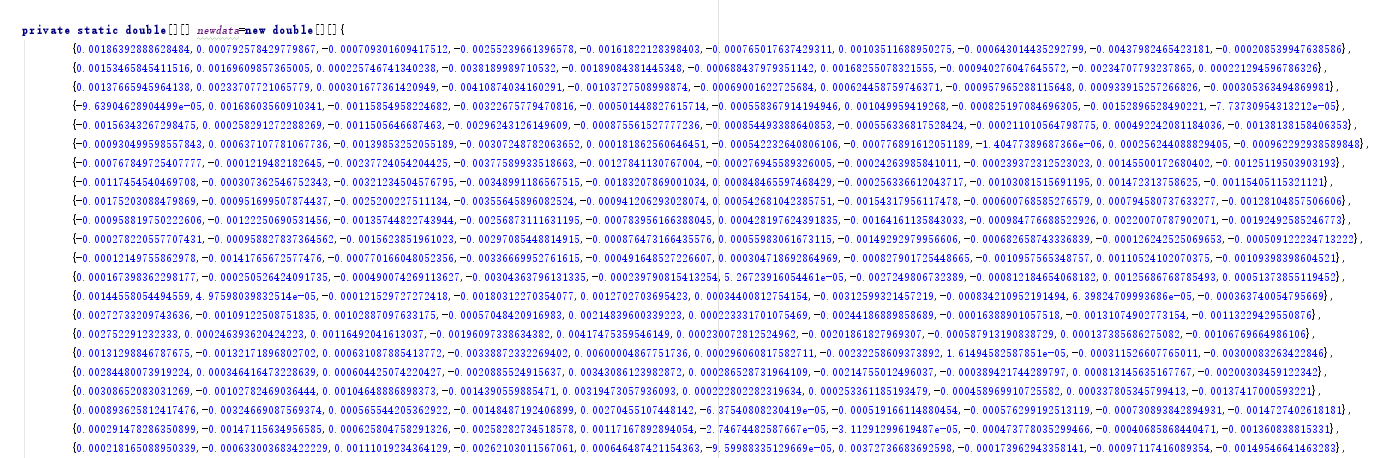
enter the data as follows in Data.java, each line represents a timestamp, and each timestamp contains attribute values for multiple objects. For example, the positive and negative values here correspond to the two states of the object.
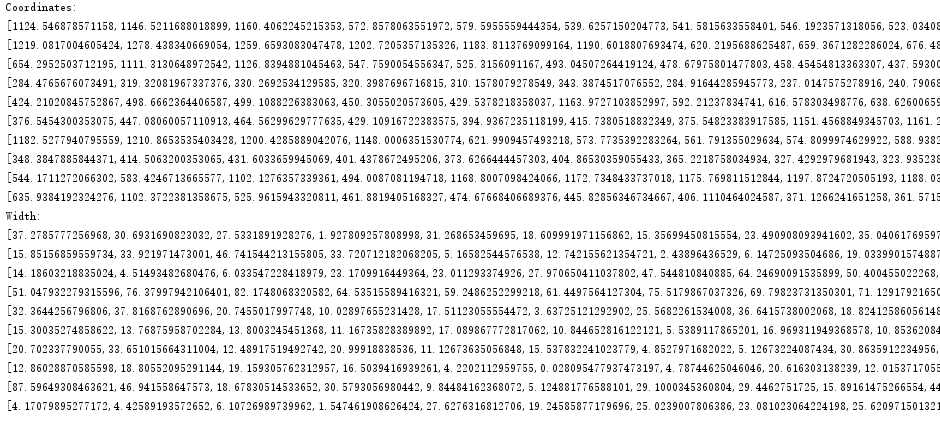
run mian.java and get output in console,copy the coordinates and width
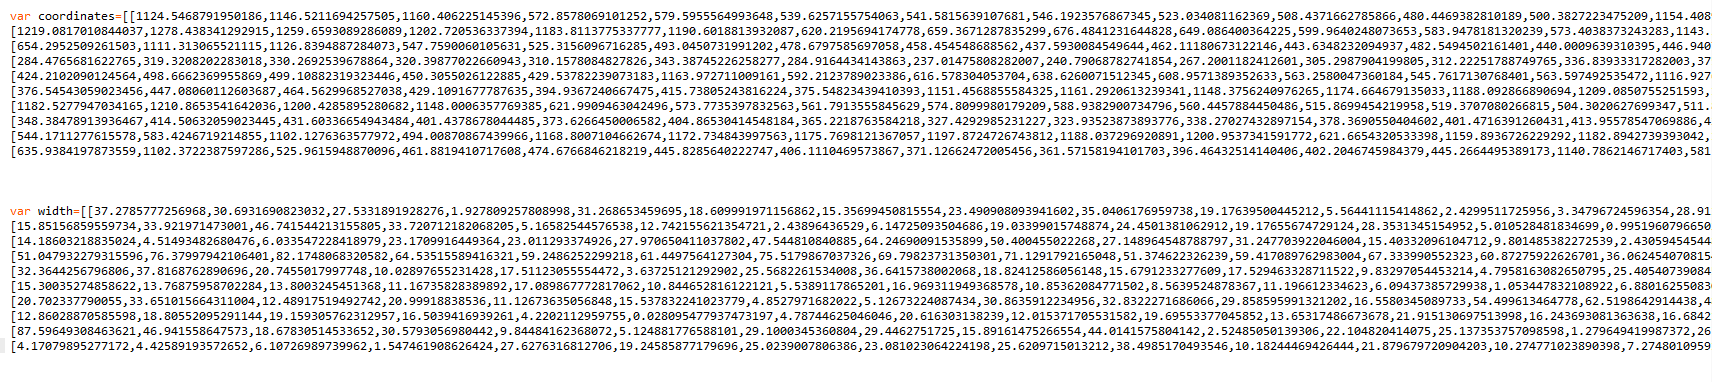
copy the coordinates and width to layoutdata.js
Sun, Guodao, et al. "EvoRiver: Visual analysis of topic coopetition on social media." IEEE Transactions on Visualization and Computer Graphics 20.12 (2014): 1753-1762.