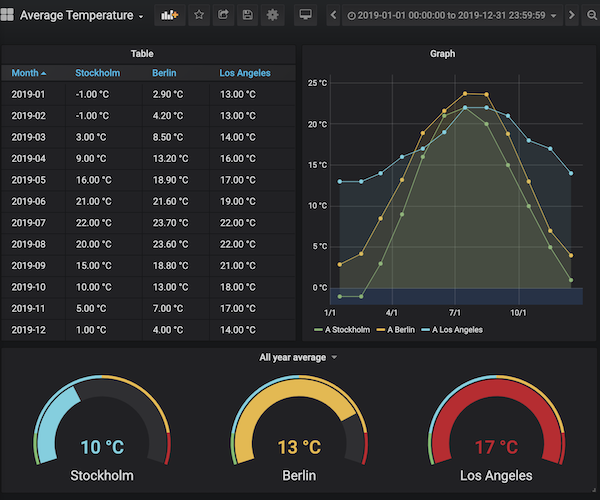
Visualize your Google Spreadsheets with Grafana
Check the docs for information on how to use the data source.
This is a basic guide on how to set up your local environment, make the desired changes and see the result with a fresh Grafana installation.
You need to install the following first:
If you have made any changes to any go files, you can use mage to recompile the plugin.
mage buildAllAfter you made the desired changes, you can build and test the new version of the plugin using yarn:
yarn run dev # builds and puts the output at ./distThe built plug-in will be in the dist/ directory.
To test the plug-in running inside Grafana, we recommend using our Docker Compose setup:
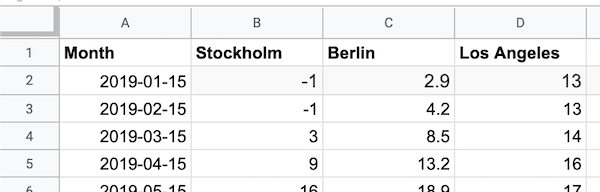
docker-compose upNeed at publicly available spreadsheet to play around with? Feel free to use this demo spreadsheet that is suitable for visualization in graphs and in tables.