Time Series: Legend and Tooltip #41104
Replies: 3 comments 6 replies
-
|
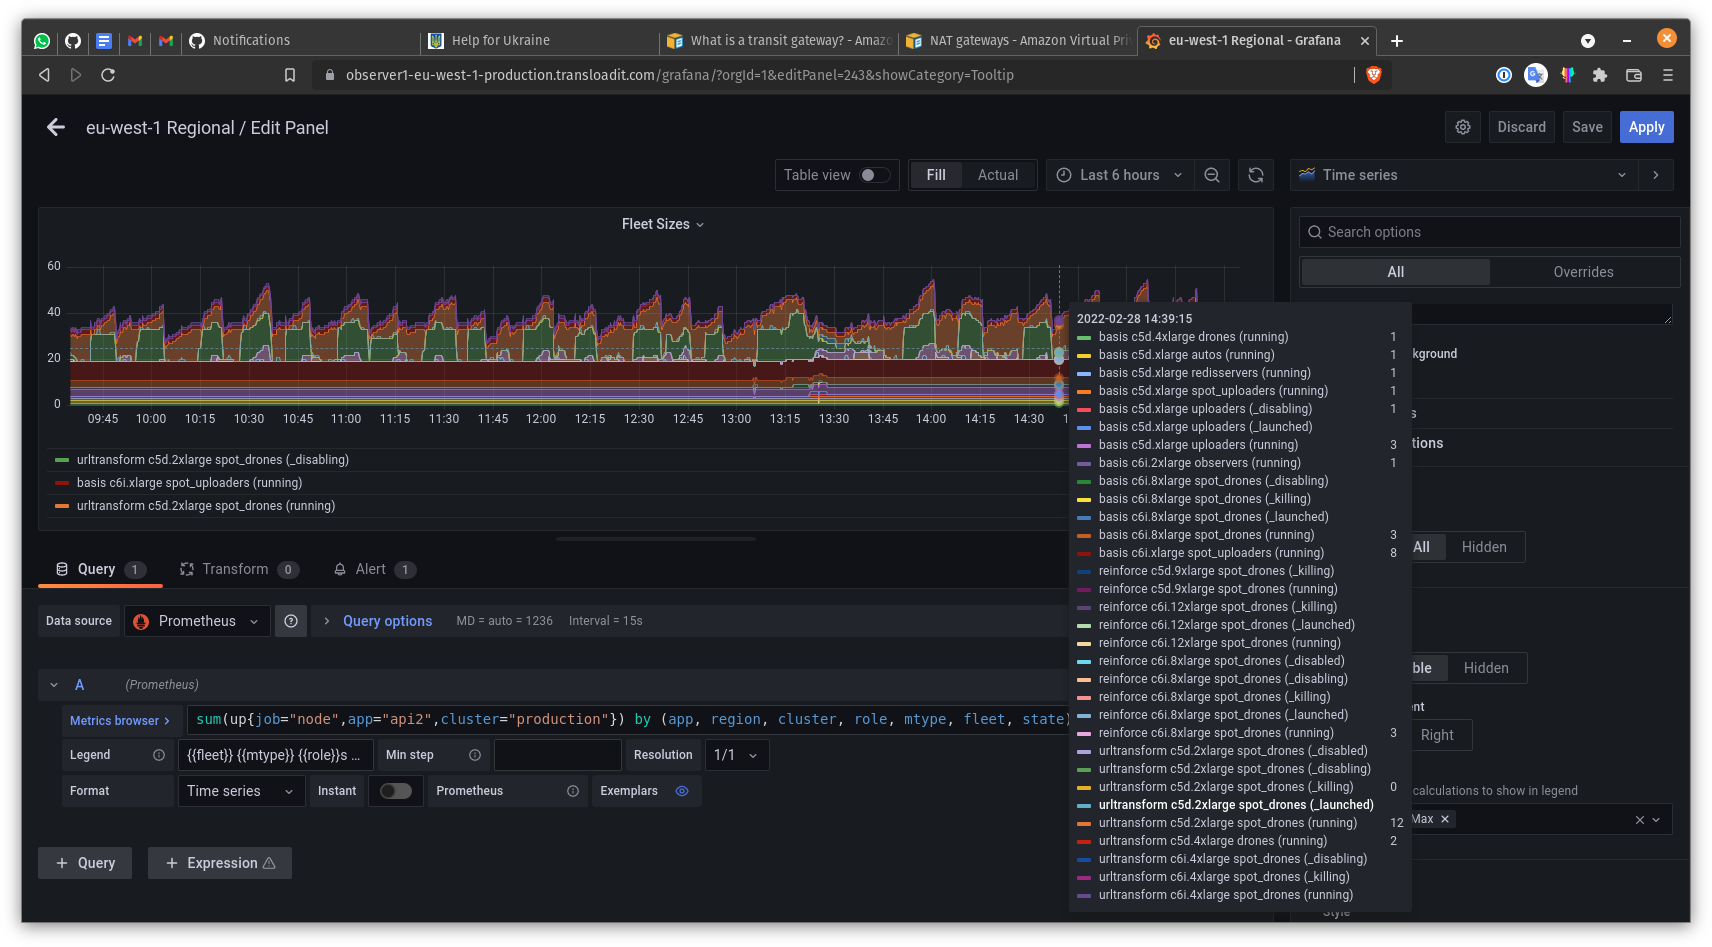
Sorting by value in the tooldtip allowed our ops team to quickly spot outliers whenever an alert came in, after having switched from Graph (old) -> Timeseries and missing this functionality, it is harder to make sense in such situations. For example:
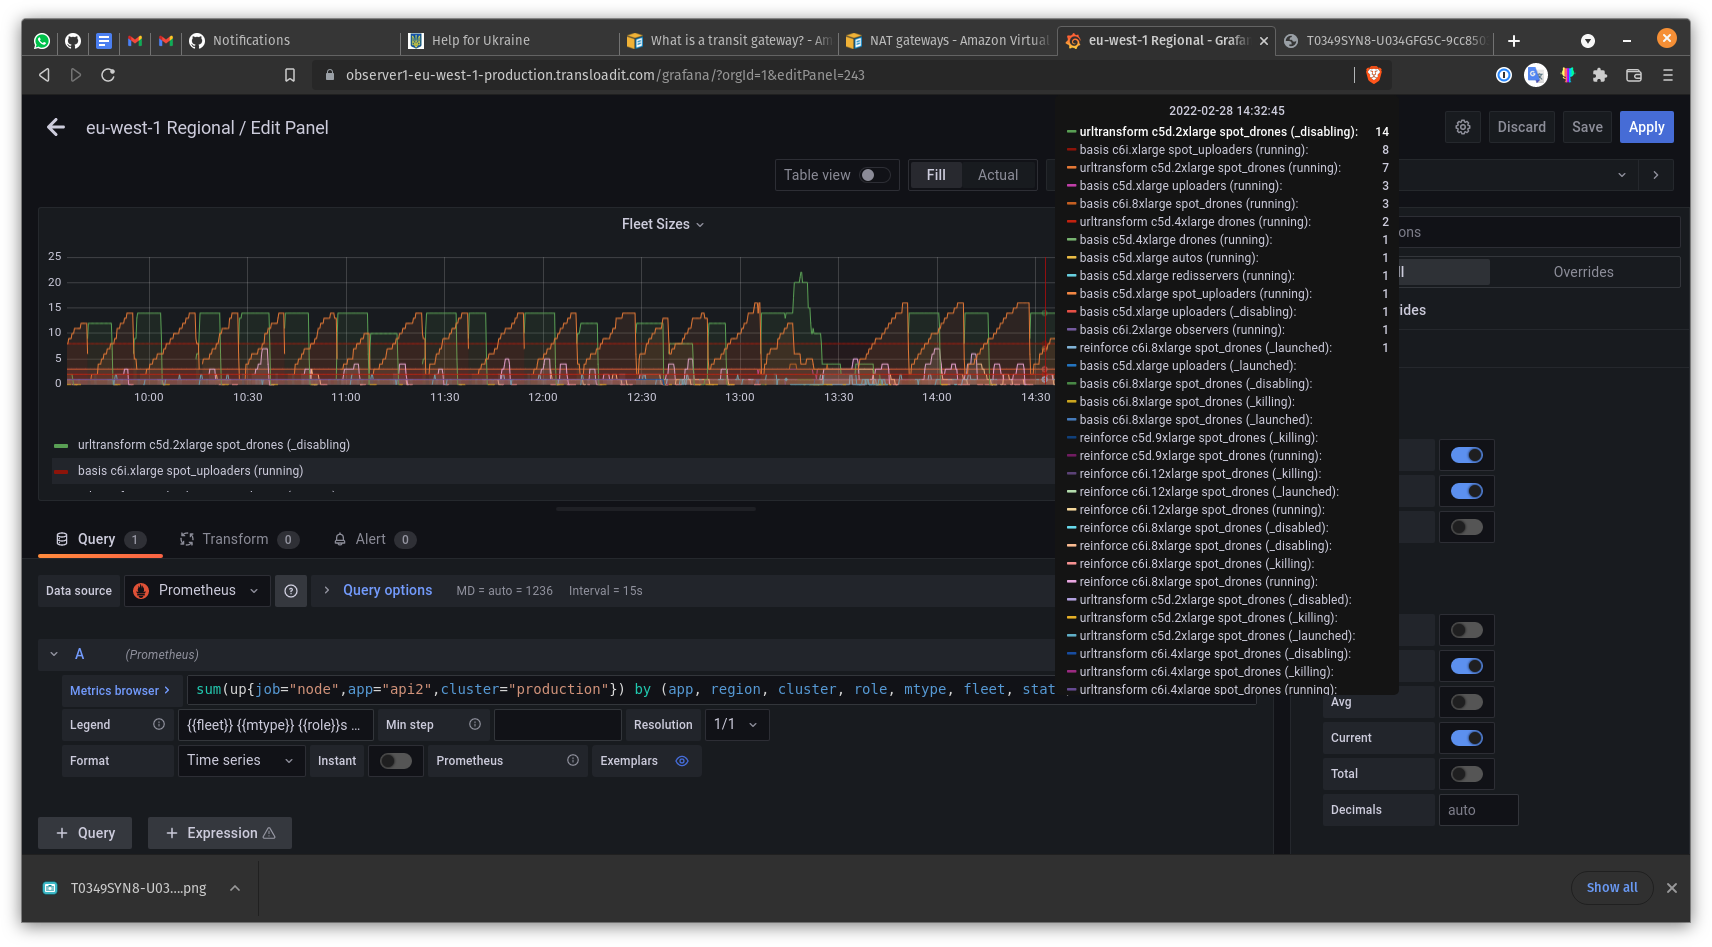
compared to previously:
|
Beta Was this translation helpful? Give feedback.
-
|
Hi @kvz we added support for that in the new time series panel in 8.4.0 #43615 |
Beta Was this translation helpful? Give feedback.
-
|
ohhhh, amazing! thank you! |
Beta Was this translation helpful? Give feedback.
-
|
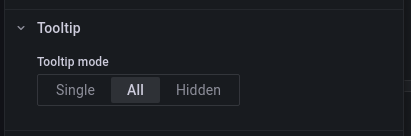
I was looking at issues related to the tooltip and I found this one. Is it on purpose that the default mode is |
Beta Was this translation helpful? Give feedback.
-
|
You can't make All default. Is it on purpose? I don't think so. @dprokop wdyt? |
Beta Was this translation helpful? Give feedback.
-
|
@zoltanbedi I think @nikobearrr is referrring to this: https://github.com/grafana/grafana/blob/main/packages/grafana-ui/src/options/builder/tooltip.tsx#L31 changing that to |
Beta Was this translation helpful? Give feedback.
-
|
I upgraded to 8.4 (it says anything else that could be missing?
|
Beta Was this translation helpful? Give feedback.
-
|
I'm not sure, it should show. I can see it working on https://play.grafana.org |
Beta Was this translation helpful? Give feedback.
-
|
This was a deployment issue on our end, sorry for the noise! Works as expected now, thank you |
Beta Was this translation helpful? Give feedback.
-
What would you like to be added:
In the old graph panel, both legend and tooltip could be sorted by value (and null series could be hidden).
Why is this needed:
This is a very useful feature when a time series panel is displaying multiple metrics and you want to quickly see the values of the top metrics.
Sorting legend or tooltip by value is no longer possible with time series. This issue was already raised in several issues. In #30907 it was mentioned "indeed the time series panel does not have legend sorting implemented. Added it to the backlog for time series/graph work: #30564". But both #30907 and #30564 have been closed without this very useful feature being implemented.
Beta Was this translation helpful? Give feedback.
All reactions