Prometheus query: query step is bound by min interval #14209
Comments
I don't think that reasonable. They are connected. Min interval controls the minimum value for step. Can you describe the reasoning? |
|
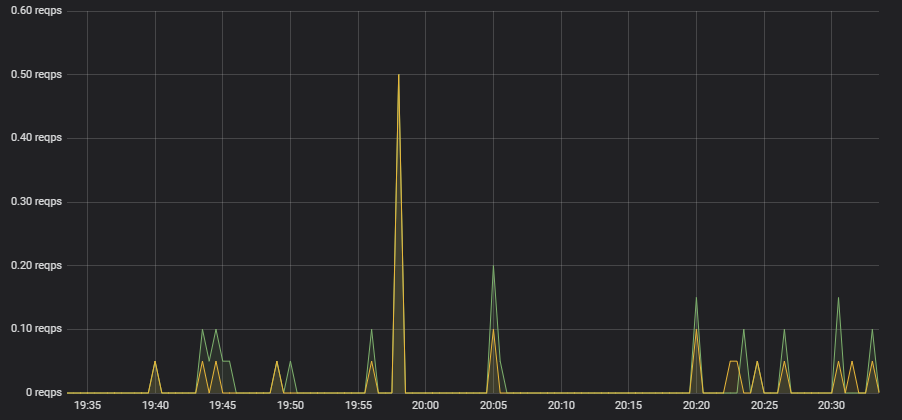
Here is a graph with a query similar to rate(my_metric[$__interval]):
The graph below is for the same query except that I manually plug in the rate interval: rate(my_metric[30s])
I guess that my assumption is that $__interval can be used with rate intervals. |

Here is my reasoning:
The 2 graphs above are looking at same data except that the top one has a resolution of 30s and the bottom one has a resolution of 10s. The top graph is missing quite of bit of data (i.e. between 20:05 and 20:20).
This is where I am confused. Maybe the time interval and step are connected in some way but I do not see why the step has to be at least equal to the time interval. This seems like an unnecessary rule. |
|
So effectively you want something like a moving average where each point includes data also included in the last point. It’s tricky, I guess we could allow a 1/3 lower step than interval but not lower than scrape interval |
I think that when graphing a rate, this is probably ok. Since a rate value is an instant vectors, it should be fine if the same point is used in multiple evaluation steps. When using the Prometheus Expression Browser, if you leave the resolution field empty (i.e. step), it uses the total graph range to calculate the resolution. The rate interval does not affect the query resolution/step at all.
In the book Prometheus Up & Running, @brian-brazil recommends the following: |

|
My 2c (although no one asked for it): the issue (in my view) is that Prometheus' What it should do for What it does instead is it takes the value of But if your counter increase happens between the last sample in a 30 second step and the first sample in the next 30 second step, it is simply ignored. And if it happens within a 30 second step, then it has an outsized influence on the rate (e.g. if the actual counter increase is 1 and your samples are 10 seconds apart, then it will return a rate equivalent to 1.5 -- because an increase of 1 over 20 seconds is extrapolated to 1.5 over 30 seconds). I've filed a feature request -- prometheus/prometheus#3806 -- and wrote the code for it -- prometheus/prometheus#3760 -- but there is no interest on their side to change anything (or to have a second implementation of So in order to fix this on the Grafana side you'd need to be able to do some interval arithmetic, rather than arbitrarily allow the step to be 3x (or whatever fixed amount) shorter than So what you'd have to do is (assuming a sample resolution of 10 seconds) something like Or, you can make use of Prometheus' brand new subquery feature and force it to create a sample every second (or whatever resolution works for you) and then compute the rate on top of that: |
|
@free unrelated: is it really the
Are you sure that prometheus is not taking the first and last value in the interval? (e.g. with timestamp // different that the value "now") |
|
@roidelapluie I don't fully understand your question, but yes, Prometheus does take the first and last values within the requested range. However, the first value within the range is not the same as the value of the counter at the beginning of the range (unless that sample falls exactly at the start of the interval, with millisecond precision). Which is what prevents it from being able to compute a rate over an arbitrary time range. E.g. if your samples are at 10 second resolution, it makes perfect sense to want to know their rate of change with 10 second resolution. Except in PromQL, which requires you to use 20 seconds and then completely fudges the actual rate (because you now only have data for 10 out of the 20 seconds and it needs to somehow make up for that). |
|
Okay. For your explanation I was thinking that prometheus was taking the last value in the range with the end of range timestamp. |
|
#21417 might be interesting. Also, I have trouble understanding why step should ever be smaller than a min interval that's based on the scrape interval. This would try to generate multiple datapoints from the same underlying data. For cleaner peaks I recommend using |
|
@davkal It seems like the range of opinions on the usage of
https://www.stroppykitten.com/technical/prometheus-grafana-statistics Just wanted to share this in case somebody comes across this issue |
What Grafana version are you using?
Grafana v5.3.2
What datasource are you using?
Prometheus
What OS are you running grafana on?
Ubuntu 18.04
What did you do?
In order to see some details on a 1-hour graph, I tried to specify: Min Step=10s and Min time interval=30s
What was the expected result?
The Prometheus query would use step=10 and $__interval=30s
What happened instead?
The query actually has the following values: step=30 and $__interval=30s.
It looks like the step cannot be less than the time interval.
However having a step of 10s with a 30s time interval seems like a reasonable thing to do.
The text was updated successfully, but these errors were encountered: