Y-max missing from graphs #19686
Comments
|
Strange unable to replicate, and no other reports. What browser and version are you using? |

|
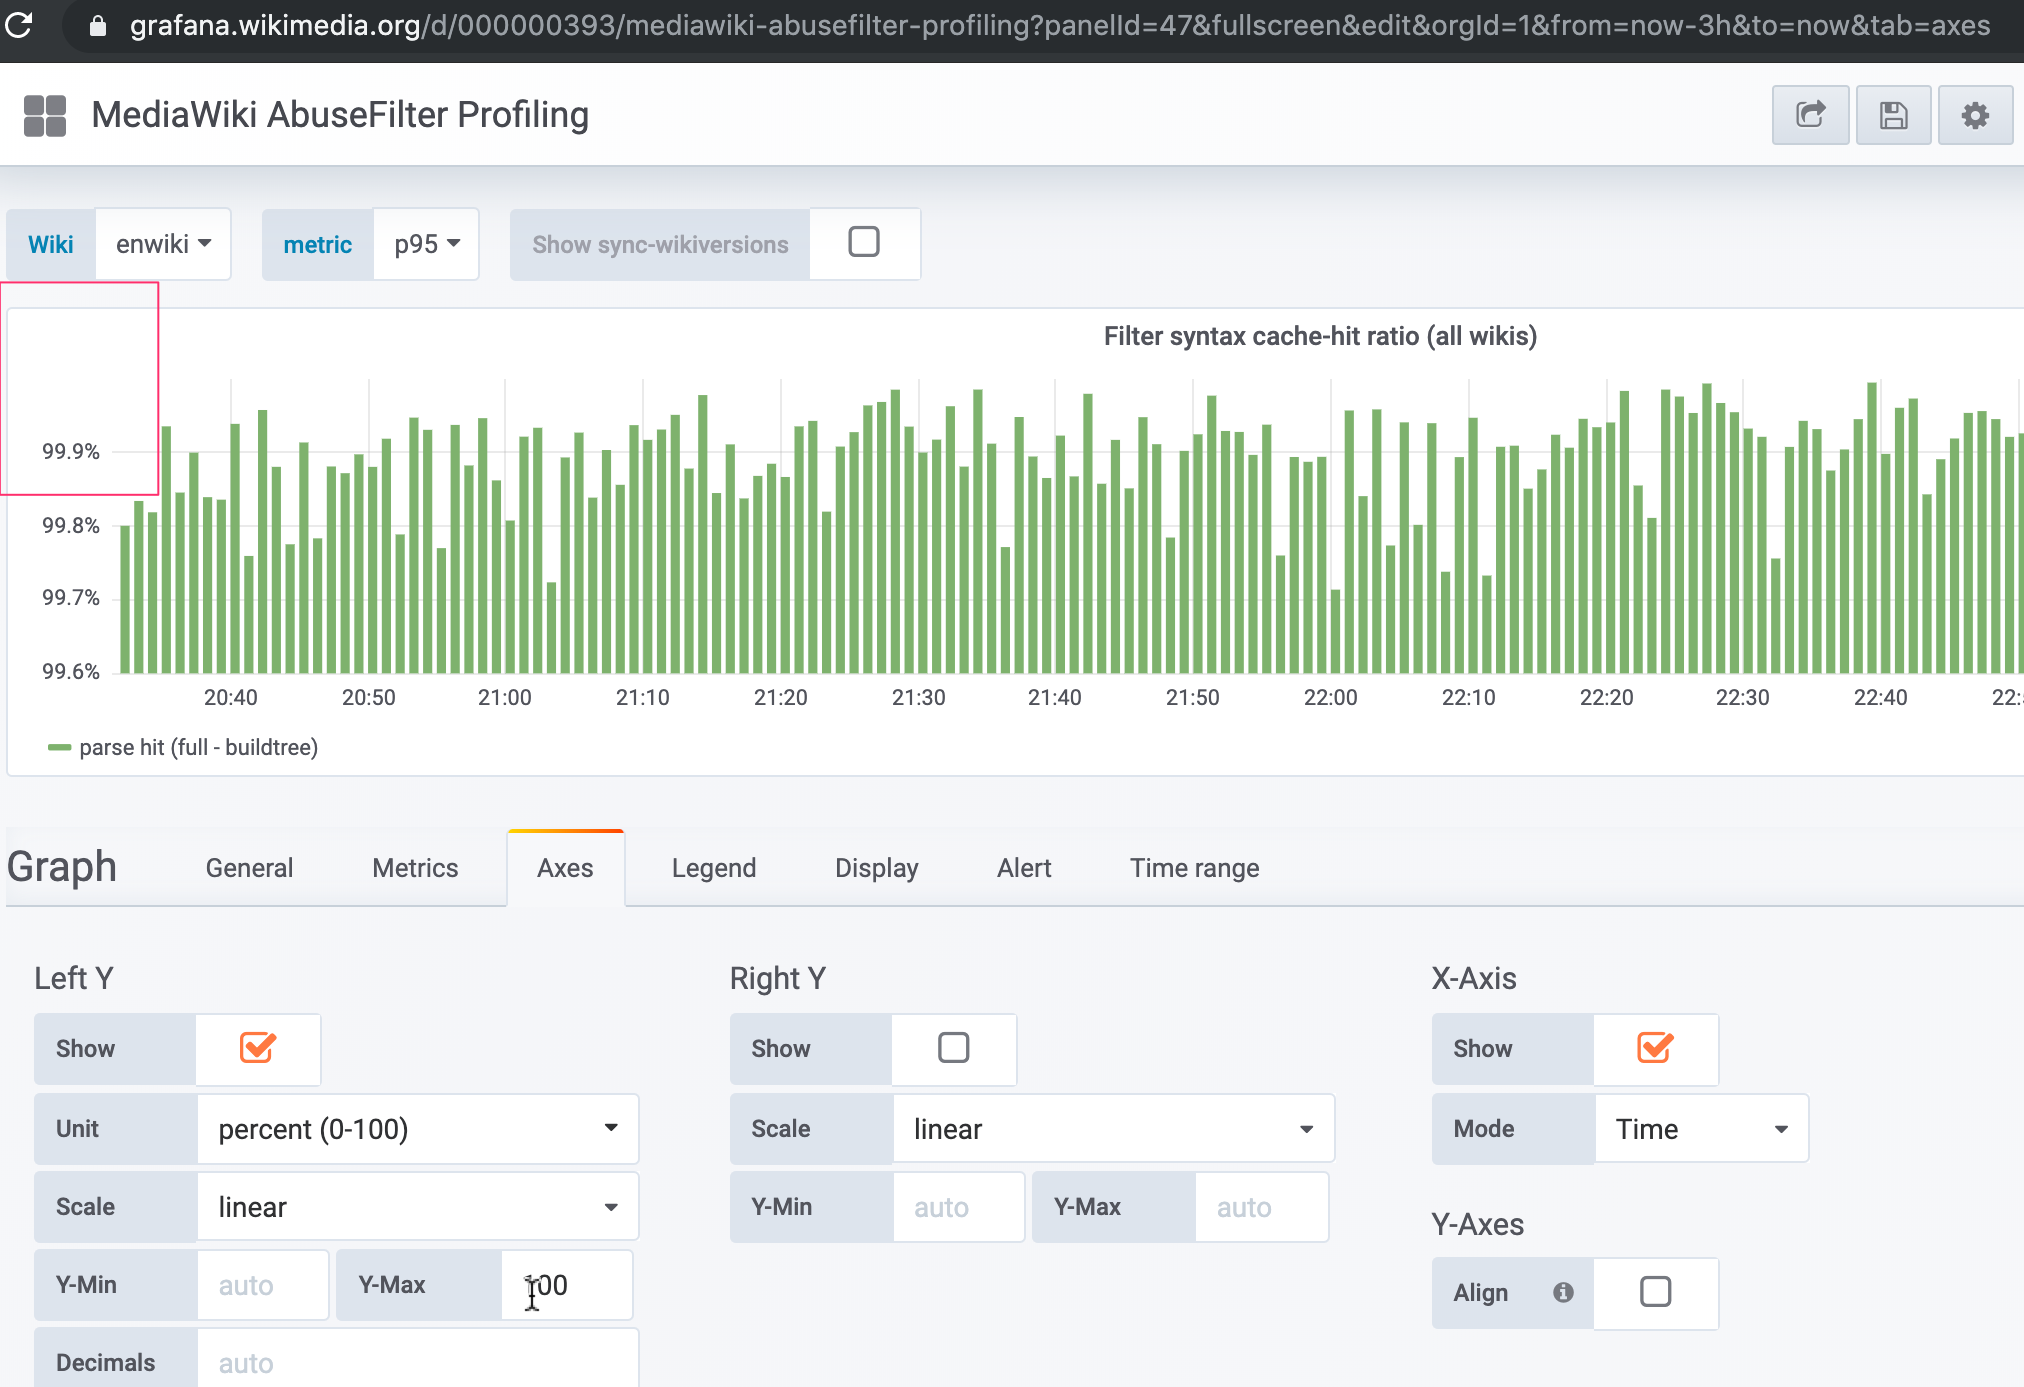
Reproduced in:
|


|
This issue has been automatically marked as stale because it has not had activity in the last year. It will be closed in 30 days if no further activity occurs. Please feel free to leave a comment if you believe the issue is still relevant. Thank you for your contributions! |
|
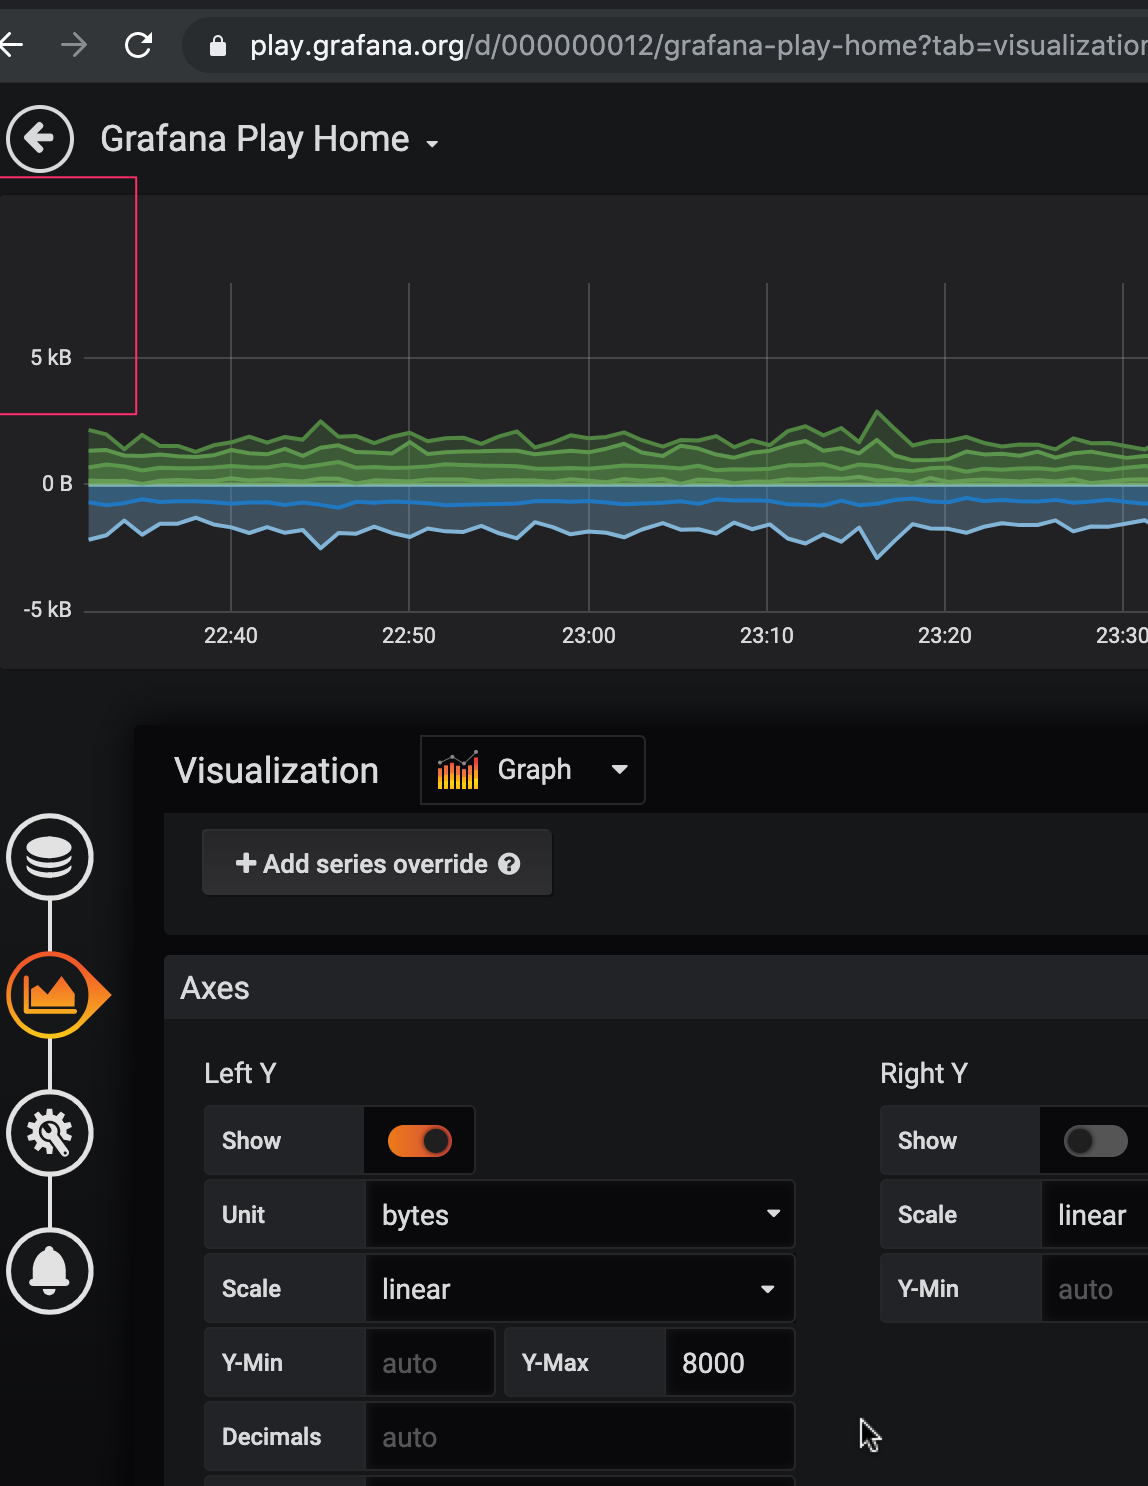
Previous example still reproducible. Some additional examples that, to me, show something that is hard to grasp and reason about as an end user. I can understand why it won't label a max that requires unreasonably small increments like 19,998 on a chart that starts at 1,000. But for these examples, it seems like it is able to change the increment to suit the range, yet for some ranges doesn't for reasons that aren't obvious.
But: |


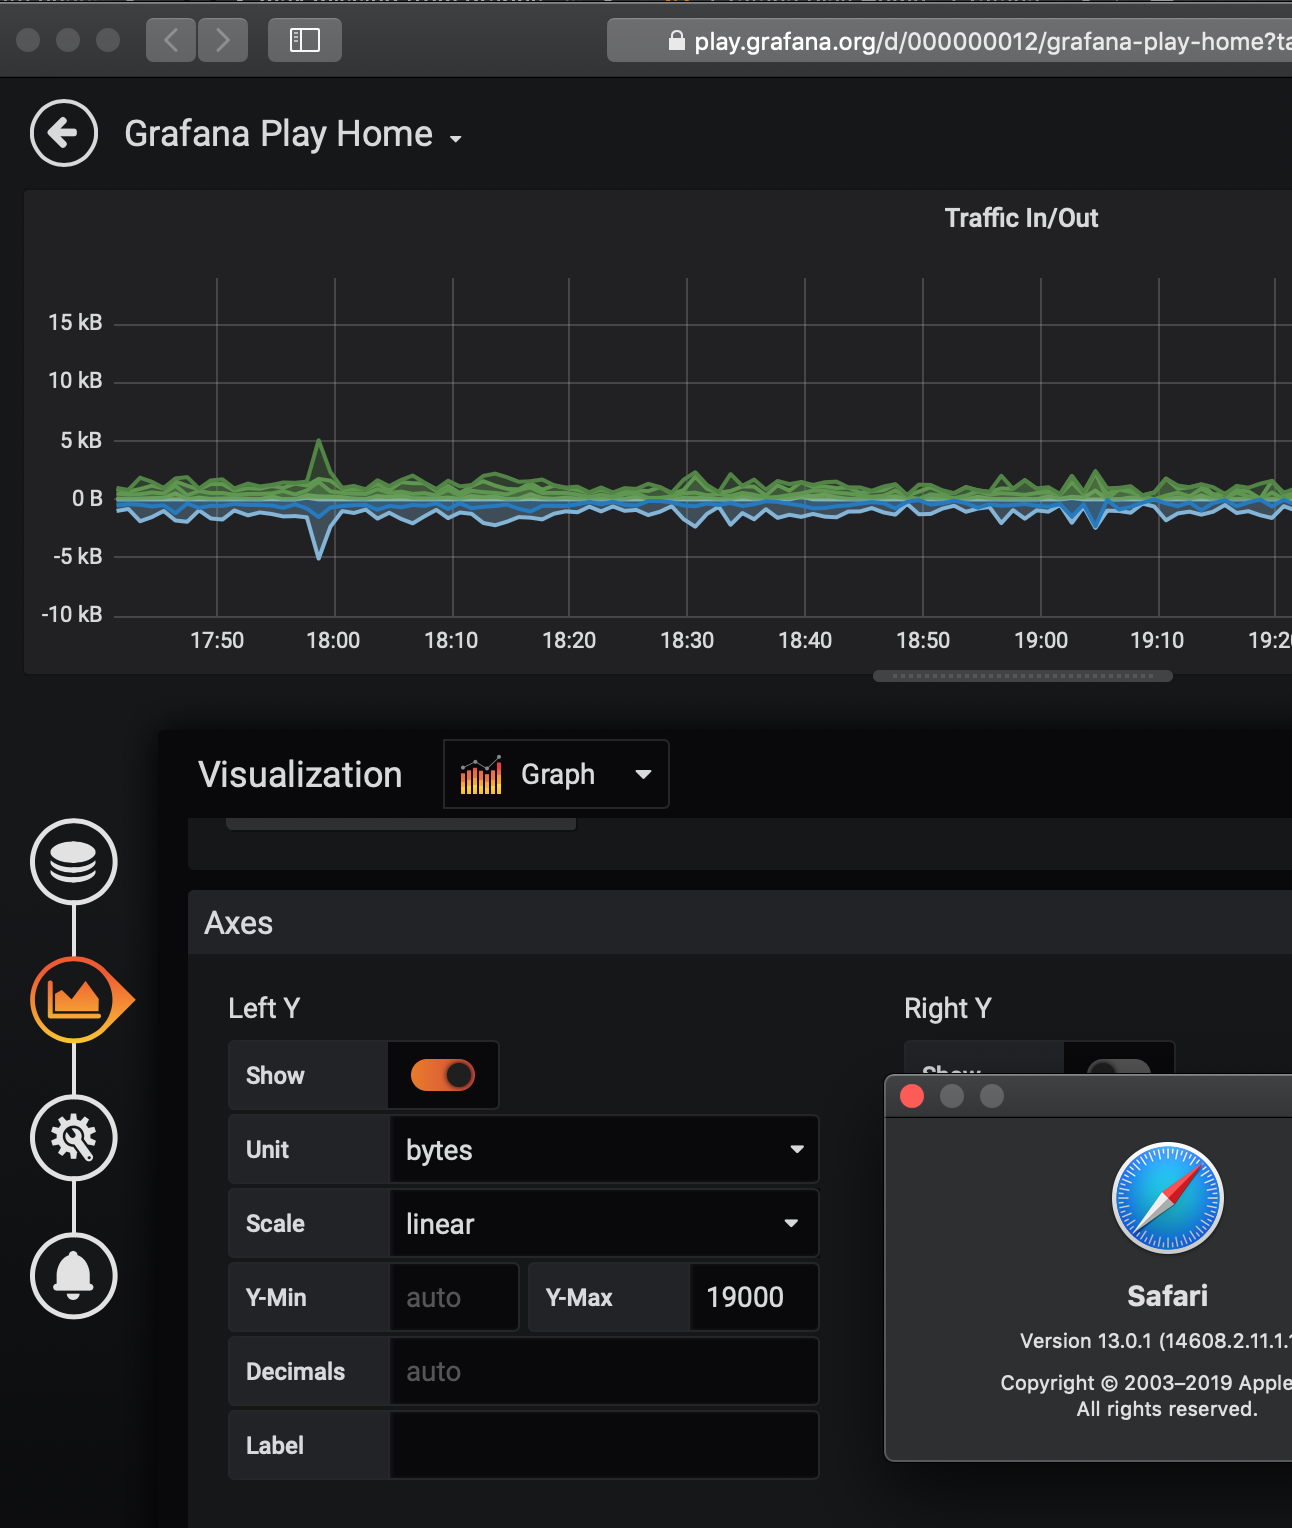
What happened: I've set a Y-max on a graph, and while the line is main part of the chart renders correctly with this max in mind, the legend is missing the top number (there is a blank gap where a number should be)
How to reproduce it (as minimally and precisely as possible):
Take any graph. Look at how far it goes on the default automatic Y-max, pick a number a bit higher than that, e.g. double. Observe that the graph shrinks correctly, but that the top part of the legend is missing.
Screenshots:
Environment:
091fd2c) at grafana.wikimedia.org4ba8388) at play.grafana.org.The text was updated successfully, but these errors were encountered: