You signed in with another tab or window. Reload to refresh your session.You signed out in another tab or window. Reload to refresh your session.You switched accounts on another tab or window. Reload to refresh your session.Dismiss alert
What would you like to be added:
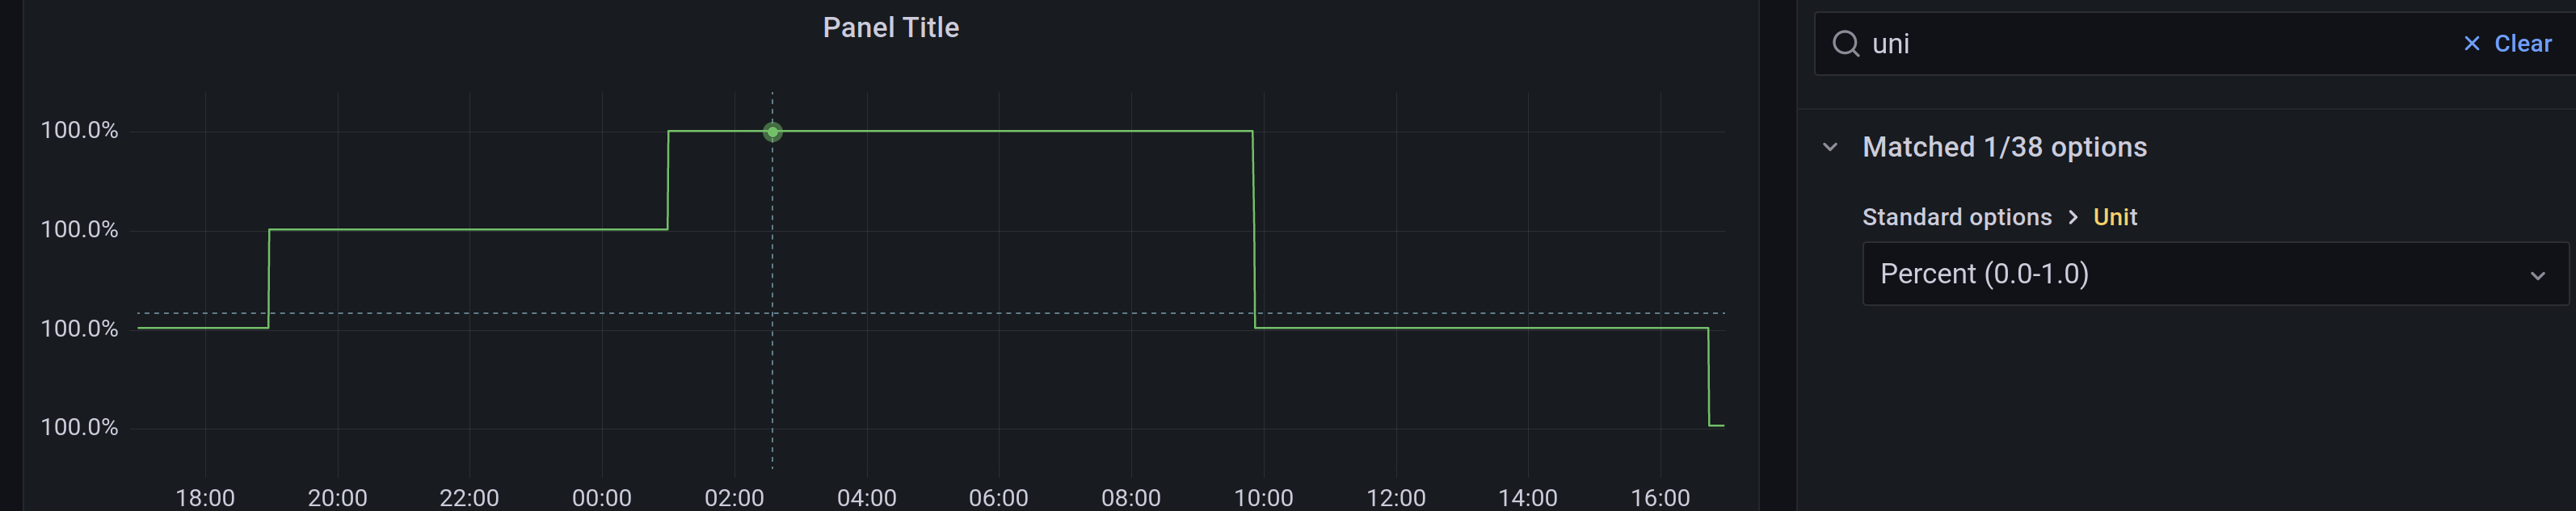
most of SLI queries leads to numbers in range of 0-1. But now (8.0.6) drawing graph in that range leads to
looks weird but ok. probably we should switch units to percent to see the actual numbers.
but
:(
and only after switching decimal
Why is this needed:
Current behavior is weird and unexpected
The text was updated successfully, but these errors were encountered:
Hello
What would you like to be added:


most of SLI queries leads to numbers in range of 0-1. But now (8.0.6) drawing graph in that range leads to
looks weird but ok. probably we should switch units to percent to see the actual numbers.
but
:(
and only after switching decimal
Why is this needed:
Current behavior is weird and unexpected
The text was updated successfully, but these errors were encountered: