Skip to content
New issue

Have a question about this project? Sign up for a free GitHub account to open an issue and contact its maintainers and the community.

By clicking “Sign up for GitHub”, you agree to our terms of service and privacy statement. We’ll occasionally send you account related emails.

Already on GitHub? Sign in to your account

Dashboard: Data source picker doesn't show tracing data sources #41976

Open
ivanahuckova opened this issue Nov 19, 2021 · 9 comments
Open

Dashboard: Data source picker doesn't show tracing data sources #41976

ivanahuckova opened this issue Nov 19, 2021 · 9 comments
Assignees
Labels
area/dashboard prio/future Used by the dashboards squad to prioritise their backlog prio/low It's a good idea, but not scheduled for any release team/grafana-dashboards Dashboards squad type/feature-request

Comments

@ivanahuckova
Copy link
Member

ivanahuckova commented Nov 19, 2021

What happened:
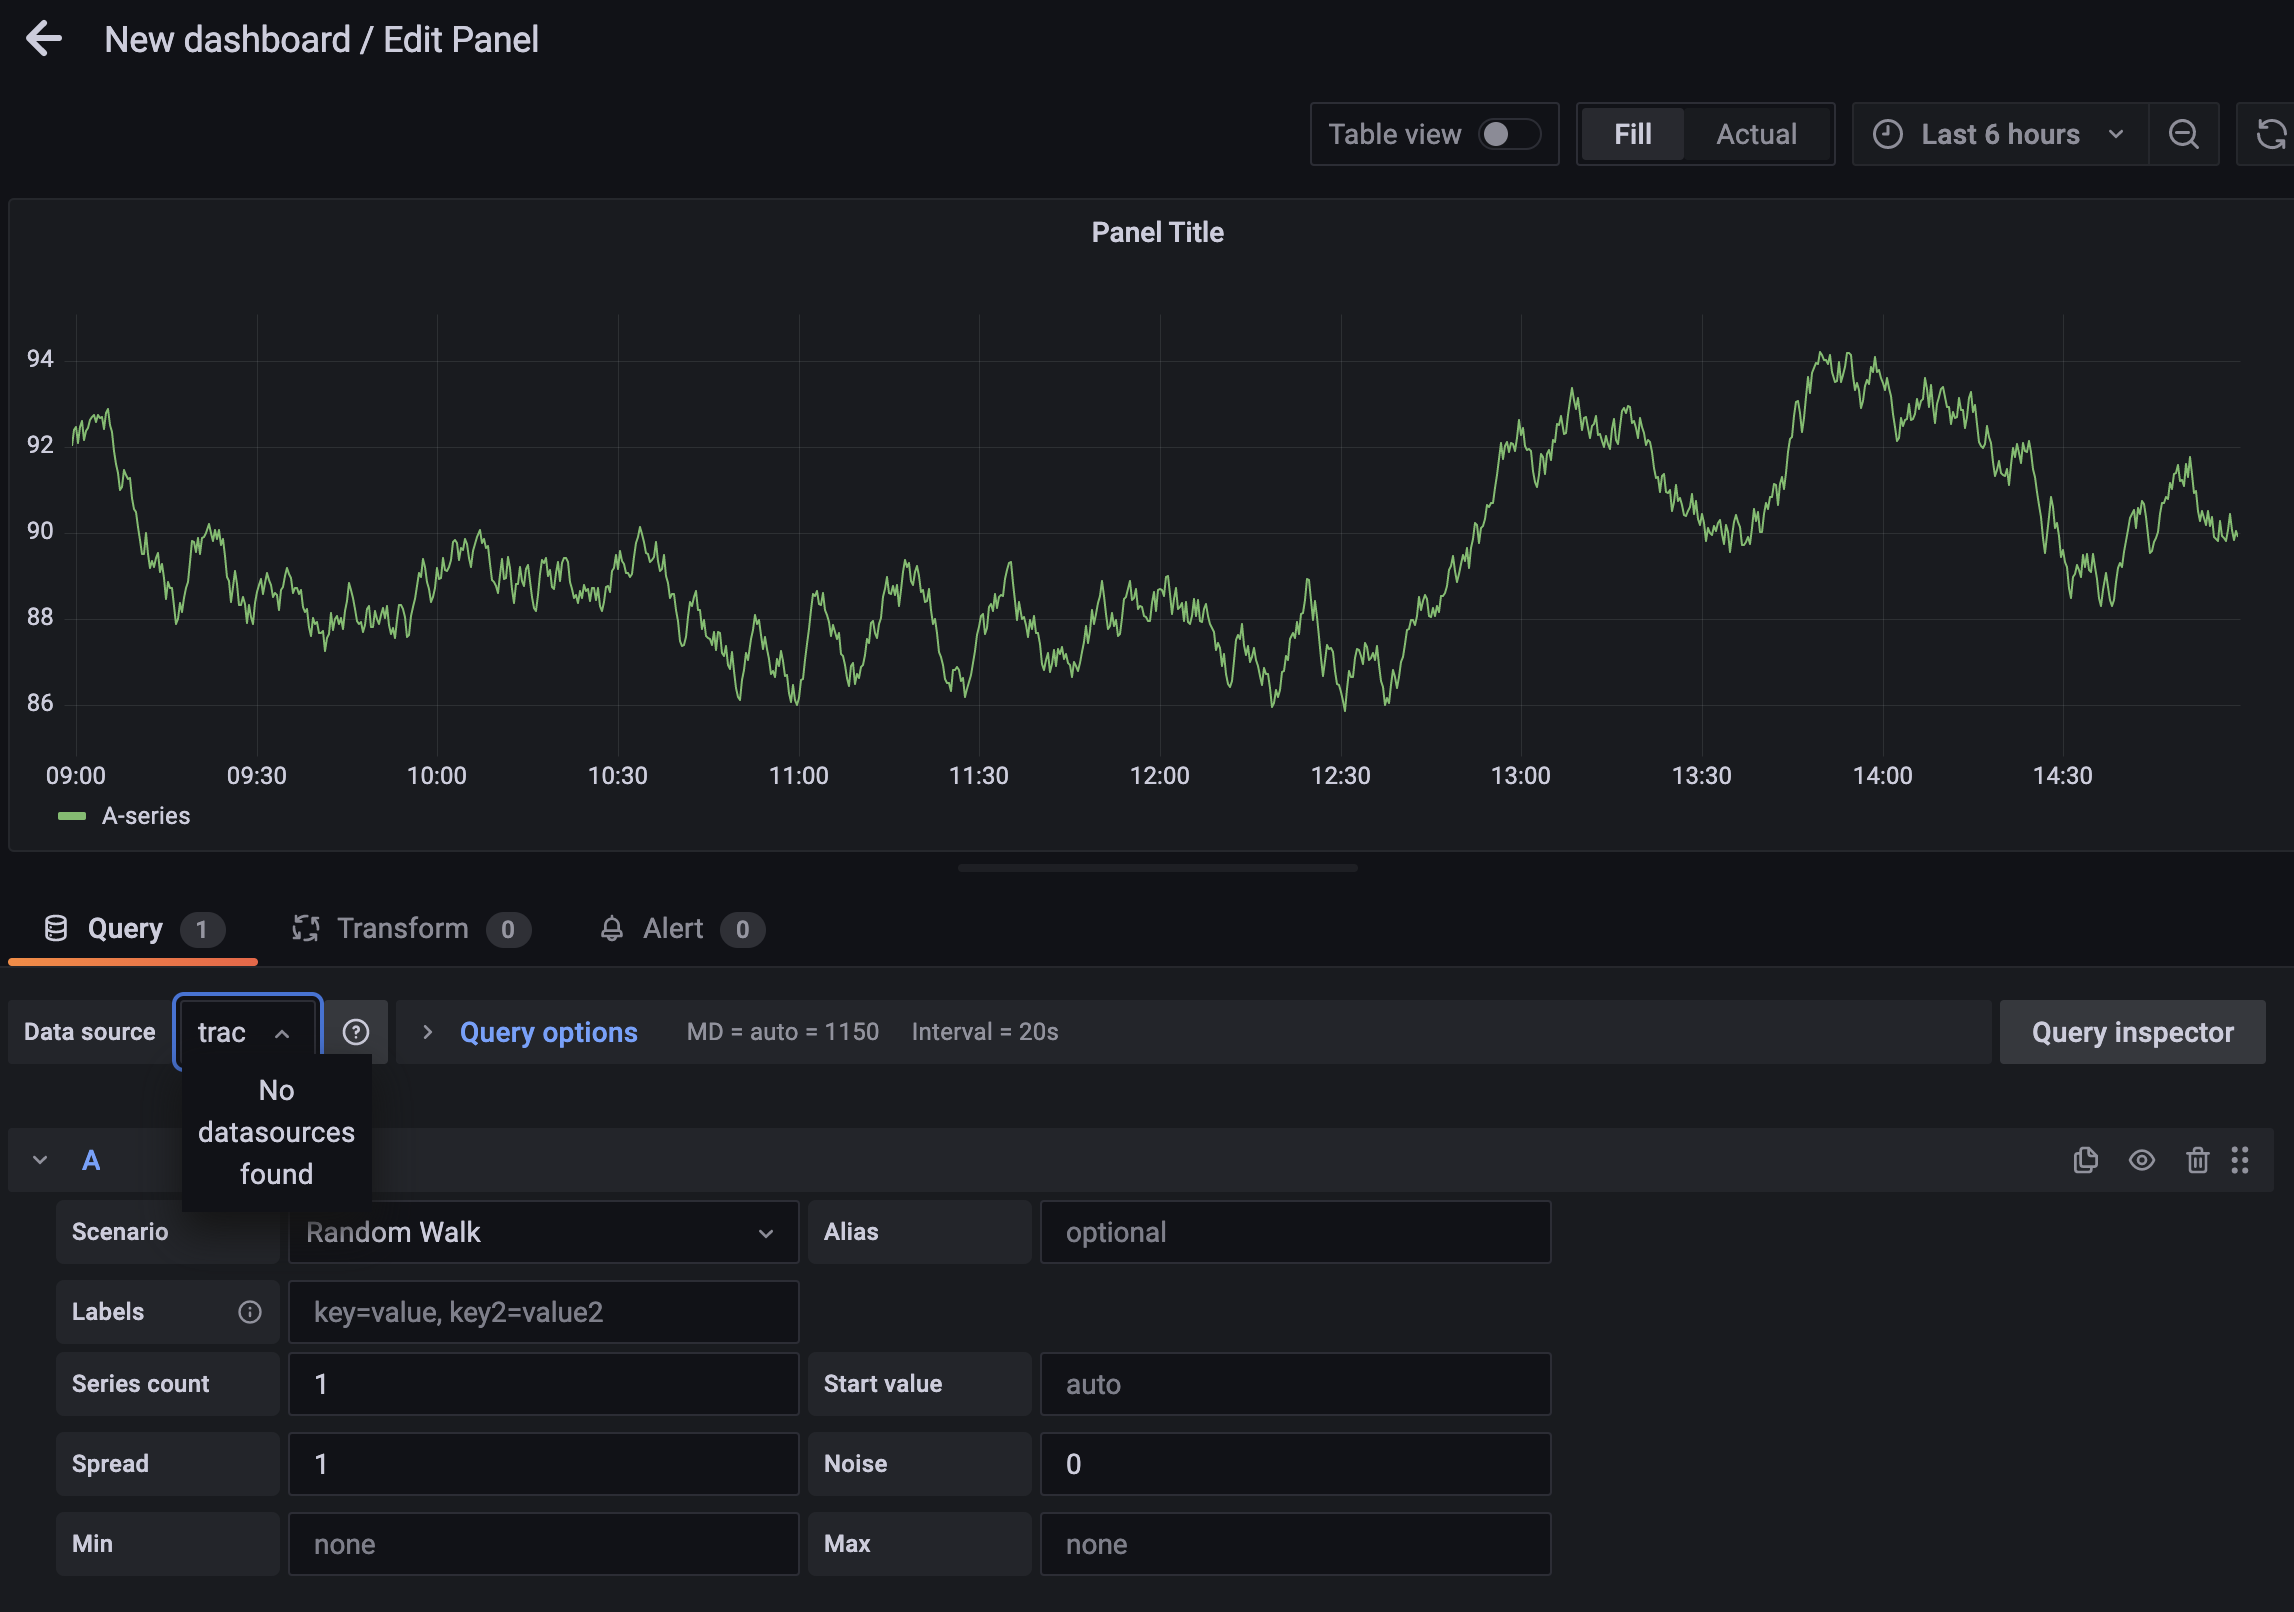
Data source picker doesn't show tracing data sources in main selection:
image

To use tracing data source, you have to choose mixed data sources and then pick tracing one.
image

We should show all available data sources, not just the metrics ones. We also have now different visualisations for non-metrics data - node graph, logs panel,...

Here - the datasource picker has metrics check: https://github.com/grafana/grafana/blob/main/public/app/features/query/components/QueryGroup.tsx#L184-L190

@torkelo
Copy link
Member

torkelo commented Nov 19, 2021

@torkelo
Copy link
Member

torkelo commented Nov 19, 2021

@ivanahuckova maybe tempo data source is missing metrics: true property in plugin.json (this signals to Grafana that it implements the query function and is not just an annotation data source). This is a bit of a legacy distinction now that annotation queries can also be implemented using main query method

@ivanahuckova
Copy link
Member Author

@torkelo I'll implement metrics=true for tracing data sources (tempo, jaeger, zipkin). Should I leave this open so at some point we'll refactor this, so all data source don't have to add metrics=true? Or there is no plan to do this and I should close the issue?

@torkelo
Copy link
Member

torkelo commented Nov 19, 2021

@ivanahuckova there is no plan, as we still have data sources that does not implement metrics query function, but maybe it should default to true?

@ivanahuckova
Copy link
Member Author

I am not sure, but it seems non-intuitive to add "metrics": true to tracing data sources so they appear in data source picker in dashboard. And also, if metrics is not true, you can still access it trough mixed data sources. 🤔 So thinking about it - I would vote yes - it should default to true and if you don't want to have it in dashboard data source list, then specify it in plugin.json.

@joshhunt
Copy link
Contributor

@torkelo What's your thoughts on how to continue with this?

I agree with how metrics: true might not be immediately obvious for how to make a data source show up in the list, but I think it might just be a quirk from confusing naming?

Alternatively, should we add tracing={true} to <DataSourcePicker />? Is there already a filter on the data sources to make sure that only those that implement .setQueryEditor() show up?

Otherwise, I think we just do nothing and continue with metrics: true. Thoughts?

@torkelo
Copy link
Member

torkelo commented Nov 26, 2021

@joshhunt

I don't have any strong thoughts, adding tracing={true} looks like the best option judging from what @aocenas said

@joshhunt joshhunt added this to Backlog (max bugs: TBD) in User essentials squad (deprecated) Nov 26, 2021
@aocenas
Copy link
Member

aocenas commented Nov 26, 2021

Yeah I guess here are my thoughts on this: #41974 (comment)

Basically thinking about these matadata on data source as "what capabilities does a data source have". So metric=true for me means it can query something that returns time series data. This may be important for things like linking trace data source to logging data source, where we want to offer only trace data sources. There is no specific contract or API that needs to be supported but this gives at least some hint for these kinds of usecases.

@ivanahuckova
Copy link
Member Author

@joshhunt in this case, when you add tracing=true to the dashboard data source picker, could you as a part of the PR remove metrics:true from jaeger, zikpin and tempo's plugin.json that I've added in #41974

@natellium natellium moved this from Backlog (max bugs: TBD) to To new project in User essentials squad (deprecated) Dec 2, 2021
@natellium natellium removed this from To new project in User essentials squad (deprecated) Dec 6, 2021
@natellium natellium added the prio/low It's a good idea, but not scheduled for any release label Jun 22, 2022
@natellium natellium added the team/grafana-dashboards Dashboards squad label Jun 23, 2023
@natellium natellium added the prio/future Used by the dashboards squad to prioritise their backlog label Aug 3, 2023
Sign up for free to join this conversation on GitHub. Already have an account? Sign in to comment
Labels
area/dashboard prio/future Used by the dashboards squad to prioritise their backlog prio/low It's a good idea, but not scheduled for any release team/grafana-dashboards Dashboards squad type/feature-request
Projects
Status: 📝 Backlog
Development

No branches or pull requests

5 participants