Bar gauge doesn't show display name when single value is returned from prometheus query #48983
Comments
|
Here's a screenshot of the bar chart query |
|
This is by design, so that you can use the panel title for name if you only have one gauge. You can change it in the stat syles / text mode option
|

|
Hi @torkelo, thanks for the response. What version of Grafana are you running? There is no Stats/Text mode in the 'Bar Gauge.' My apologies, as I stated "Bar Chart" in my title and issue previously, not 'Bar gauge' . I'll try to switch my graphs 'bar chart' to see if I can use it instead in the meantime.
|

|
The 'beta' Bar chart is not solving my issue. Can we re-open this one or should I open a new issue with the correct panel "Bar guage" vs "Bar chart". Incidentally, using the panel title for the name with one gauge is not an option since these panel are generated dynamically based on the promQL query. Also, I still am not seeing that Stat Styles/Text Mode option in the Bar chart panel. Maybe I'm dense but it could be you are on previous version of Grafana where that exists. |
|
Sorry i meant bar gauge, your screenshot is from bar gauge and it has an option to always show name and value |
|
@torkelo thanks again for the response. It looks like you are actually looking at the Stat visualization (below screenshot), not the Bar gauge. There is no Stat Styles/Text Mode option in Bar gauge. I even went back to grafana 7.5 to check. I guess I can open a feature request to have this same/similar option added to Bar gauge.
|

|
Hi, sorry, forgot that Bar gauge does not have this option. You can work around this problem by specifying |
|
You da man! Thanks for the work around! Works as I need now. |
Hi Torkelo, Where I need to add that, Regards, |

|
|


|
@petergsn This is where I added it... |

|
Hi, I am getting below, But I am looking for below one, alertsmanagementresources But it works perfectly if multiple values are there. |


|
Hello @petergsn! I catch the same issue, and for me working |
|
Hi, just ran into the same issue on the Bar Gauge where I have a score card repeating for each area. the ${__field.labels} work around resolved it |
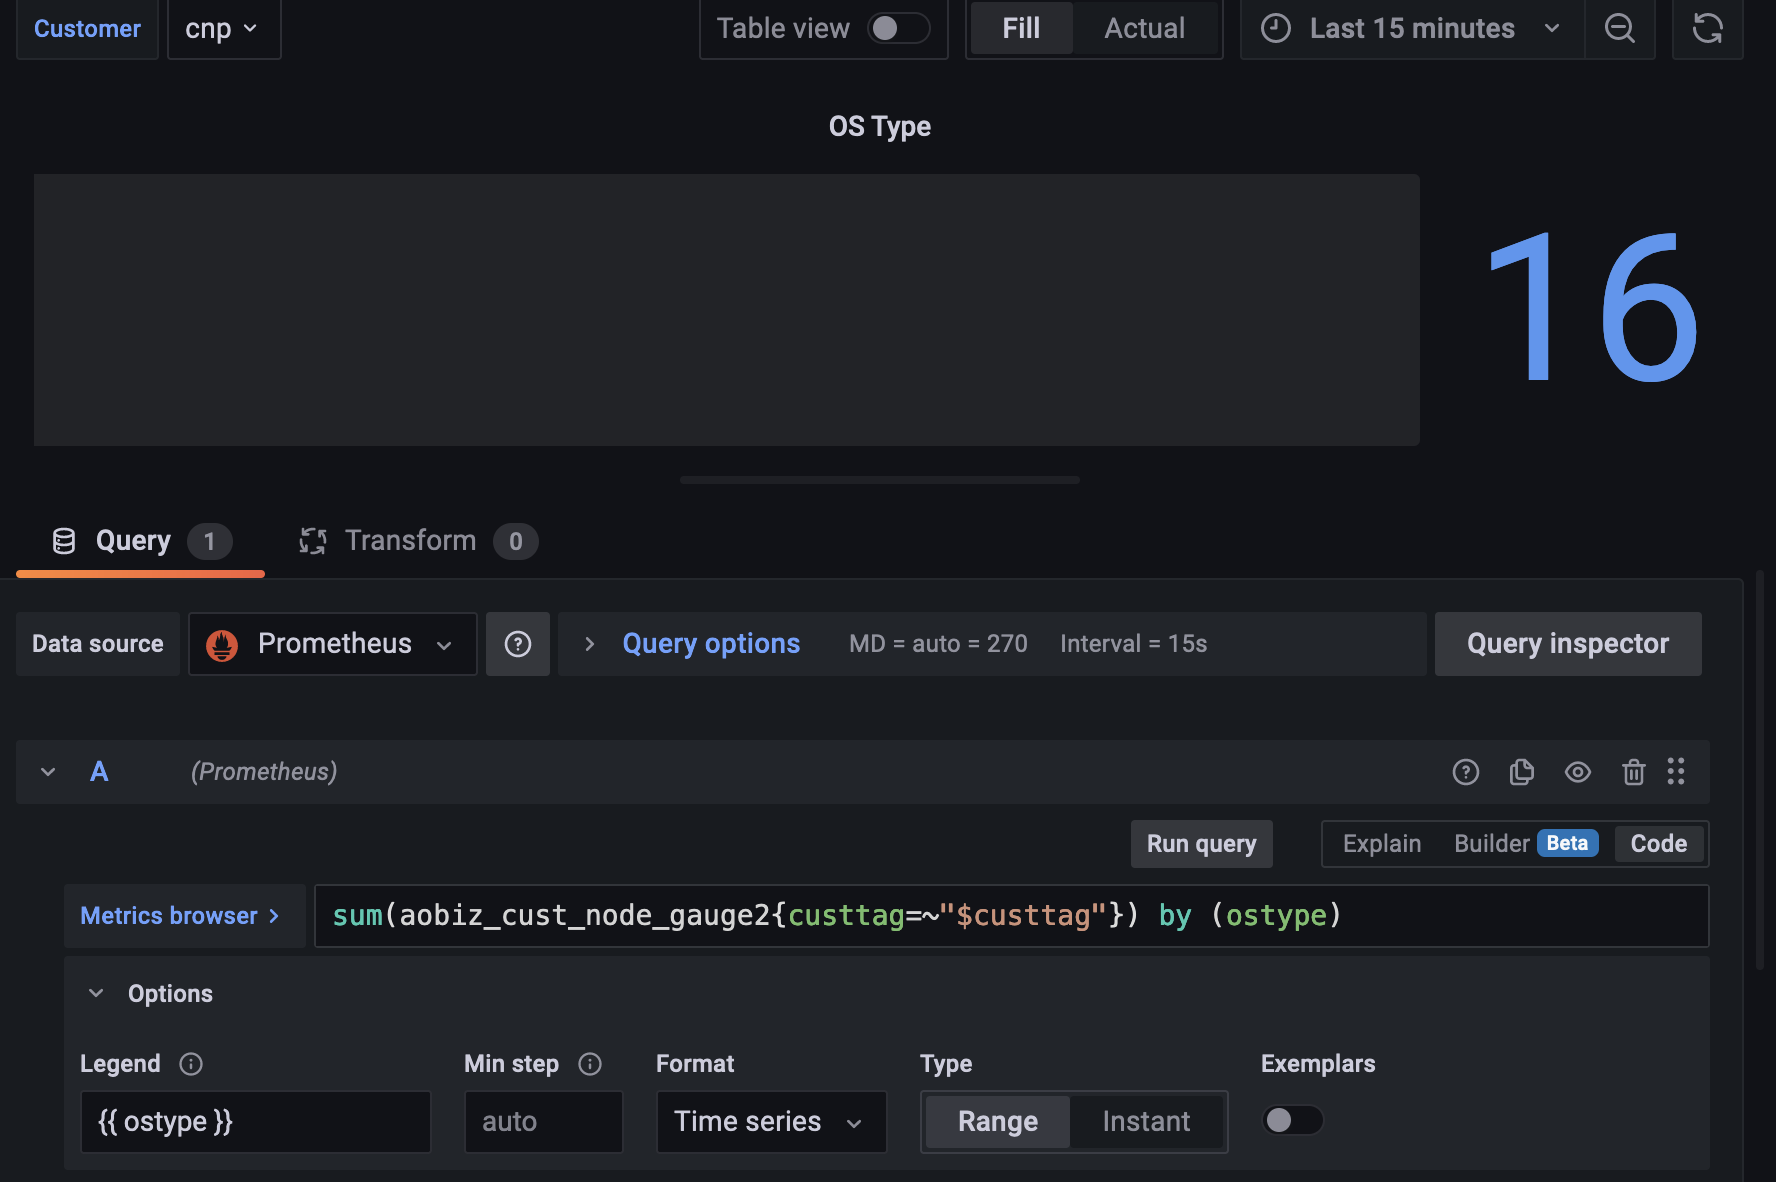
What happened:
In a bar gauge with a prom query like
sum(aobiz_cust_node_gauge2{custtag=~"cnp"}) by (ostype)the bar chart displays all 'ostype's in the proper format (ostype name, bar and value) when there is more than one 'ostype' to display. However, when there is only a single 'ostype' returned, the display name for the 'ostype' does not appear. For example, if all nodes for the dashboard are of ostype 'linux-rh7.9' that ostype name is not displayed in the chart.What you expected to happen:
The ostype name should display in the bar chart. I believe it's the legend value that is not being displayed.
How to reproduce it (as minimally and precisely as possible):

This is what the bar chart looks like when multiple 'ostypes' are returned from the query:
This is what bar chart looks like when only one 'ostype' is returned from the query. Notice the name 'linux-rh7.9' is not displayed and the bar itself is not filled in):
Return query:

Anything else we need to know?:
Environment:
The text was updated successfully, but these errors were encountered: