Skip to content
New issue

Have a question about this project? Sign up for a free GitHub account to open an issue and contact its maintainers and the community.

By clicking “Sign up for GitHub”, you agree to our terms of service and privacy statement. We’ll occasionally send you account related emails.

Already on GitHub? Sign in to your account

Data link takes wrong values with __data.fields #54768

Open
m1hanick opened this issue Sep 6, 2022 · 5 comments
Open

Data link takes wrong values with __data.fields #54768

m1hanick opened this issue Sep 6, 2022 · 5 comments
Labels
area/dashboard/data-links prio/future Used by the dashboards squad to prioritise their backlog team/grafana-dashboards Dashboards squad type/bug

Comments

@m1hanick
Copy link

m1hanick commented Sep 6, 2022

What happened:
We have a Jaeger datasource with trace statistics (TraceId, Tracename, Duration, StartTime)
We want to draw a dotted time-series graph just like the Jaeger native UI does
Each dot should represent a trace and also it should have a datalink to the Explorer to get a detailed trace view.
We use data links to prepare an URL to the Explorer.
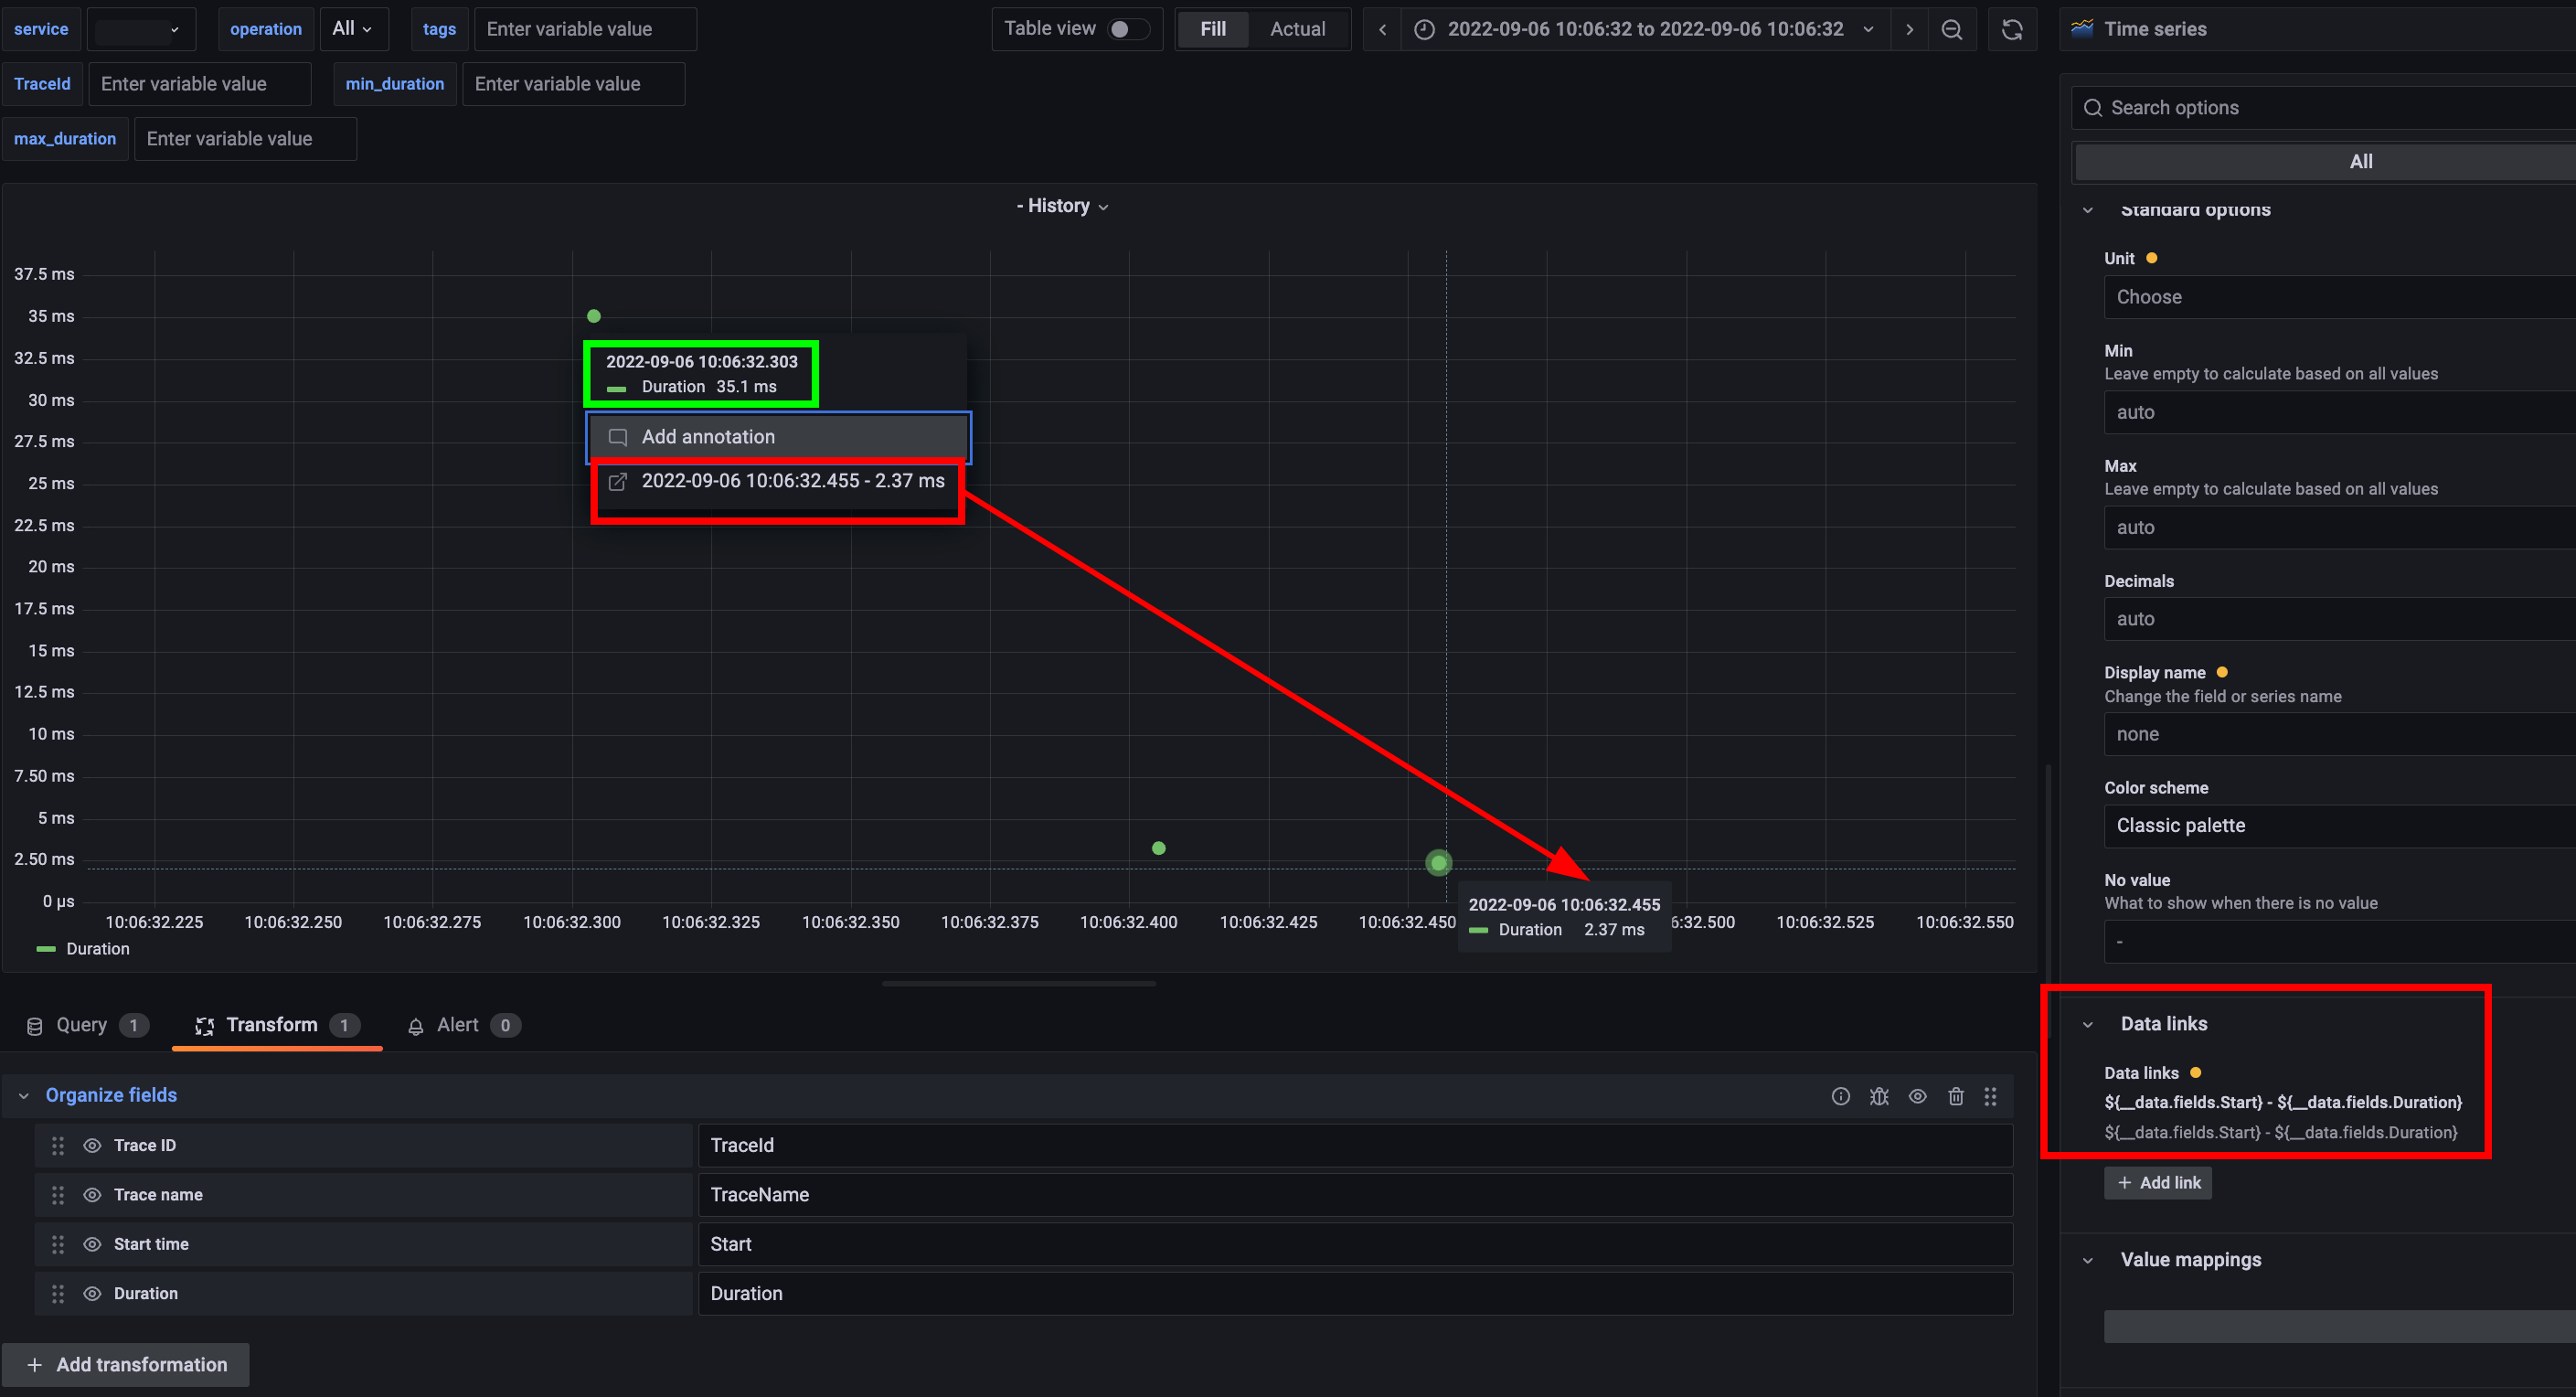
However, as we see datalinks grab the wrong values and bound them to data points.
If it's only one data point on a graph, everything is fine, but if there are many, links get generated for points located on the opposite side of the timeline (the leftmost point gets a link to the rightmost and vice versa)
Example

What you expected to happen:
By clicking on a data link associated with any particular data point(a trace) we get navigated to the Explorer view with details of this exact trace

How to reproduce it (as minimally and precisely as possible):

  1. Get a Jaeger trace datasource
  2. Set a timeseries dotted graph
  3. Configure the "Organize fields" transformation (dunno why, but datalink doesn't work at all without it)
  4. Add a datalink
    Title: ${__data.fields['TraceName']} - ${__data.fields['Duration']}
    URL: https://grafana/explore?left={"datasource":"Jaeger","queries":[{"query":"${__data.fields['TraceId']}" }]}

Environment:

  • Grafana version: 9.1.0 (9.1.3 is also affected)
  • Data source type & version: Jaeger
  • OS Grafana is installed on: Centos
  • User OS & Browser: MaOS, Chrome 104.0.5112.101
  • Grafana plugins: only build-in
  • Others:
@ivanahuckova
Copy link
Member

@m1hanick Could you please share the panel/dashboard JSON with us? Thank you!

@ivanahuckova ivanahuckova added needs investigation for unconfirmed bugs. use type/bug for confirmed bugs, even if they "need" more investigating area/dashboard/data-links labels Sep 6, 2022
@m1hanick
Copy link
Author

m1hanick commented Sep 6, 2022

Hi @ivanahuckova
here is the panel json
{ "id": 2, "gridPos": { "h": 6, "w": 24, "x": 0, "y": 2 }, "type": "timeseries", "title": "$service - History", "transformations": [ { "id": "organize", "options": { "excludeByName": {}, "indexByName": {}, "renameByName": { "Trace ID": "TraceId", "Trace name": "TraceName" } } } ], "datasource": "Jaeger", "fieldConfig": { "defaults": { "custom": { "drawStyle": "points", "lineInterpolation": "linear", "barAlignment": 0, "lineWidth": 1, "fillOpacity": 0, "gradientMode": "none", "spanNulls": false, "showPoints": "auto", "pointSize": 10, "stacking": { "mode": "none", "group": "A" }, "axisPlacement": "auto", "axisLabel": "", "axisColorMode": "text", "scaleDistribution": { "type": "linear" }, "axisCenteredZero": false, "hideFrom": { "tooltip": false, "viz": false, "legend": false }, "thresholdsStyle": { "mode": "off" } }, "color": { "mode": "palette-classic" }, "mappings": [], "thresholds": { "mode": "absolute", "steps": [ { "color": "green", "value": null } ] }, "links": [ { "targetBlank": true, "title": "${__data.fields['TraceName']}", "url": "https://grafana-url/explore?left={\"datasource\":\"Jaeger\",\"queries\":[{\"query\":\"${__data.fields['TraceId']}\" }]}" } ] }, "overrides": [] }, "options": { "tooltip": { "mode": "single", "sort": "none" }, "legend": { "showLegend": true, "displayMode": "list", "placement": "bottom", "calcs": [] } }, "targets": [ { "datasource": "Jaeger", "maxDuration": "${max_duration}", "minDuration": "${min_duration}", "operation": "${operation}", "queryType": "search", "refId": "A", "service": "${service}", "tags": "${tags}" } ] }

@m1hanick
Copy link
Author

m1hanick commented Sep 7, 2022

Hi, I've checked the same with Tempo
and the datalink behavior is the same
image

Here is the panel json:
{ "gridPos": { "x": 0, "y": 0, "w": 12, "h": 8 }, "type": "timeseries", "title": "New Panel", "datasource": { "uid": "tempo", "type": "tempo" }, "targets": [ { "refId": "A", "key": "Q-38c7ce2c-ca80-4070-a88f-d69d6cafcd9c-0", "queryType": "nativeSearch", "serviceName": "issa-aq", "datasource": { "type": "tempo", "uid": "tempo" }, "limit": 1000, "spanName": "PRIME commit" } ], "options": { "tooltip": { "mode": "single", "sort": "none" }, "legend": { "showLegend": true, "displayMode": "list", "placement": "bottom", "calcs": [] } }, "fieldConfig": { "defaults": { "custom": { "drawStyle": "points", "lineInterpolation": "linear", "barAlignment": 0, "lineWidth": 1, "fillOpacity": 0, "gradientMode": "none", "spanNulls": false, "showPoints": "auto", "pointSize": 5, "stacking": { "mode": "none", "group": "A" }, "axisPlacement": "auto", "axisLabel": "", "axisColorMode": "text", "scaleDistribution": { "type": "linear" }, "axisCenteredZero": false, "hideFrom": { "tooltip": false, "viz": false, "legend": false }, "thresholdsStyle": { "mode": "off" } }, "color": { "mode": "palette-classic" }, "mappings": [], "thresholds": { "mode": "absolute", "steps": [ { "value": null, "color": "green" }, { "value": 80, "color": "red" } ] }, "links": [ { "title": "${__data.fields['Duration']} - ${__data.fields['Start']}", "url": "${__data.fields['Duration']}" } ] }, "overrides": [] }, "id": 1, "pluginVersion": "9.1.3", "transformations": [ { "id": "convertFieldType", "options": { "fields": {}, "conversions": [ { "targetField": "Start time", "destinationType": "time" } ] } }, { "id": "organize", "options": { "excludeByName": {}, "indexByName": {}, "renameByName": { "Trace ID": "ID", "Trace name": "Name", "Start time": "Start", "Duration": "Duration" } } } ] }

@eledobleefe
Copy link
Contributor

Hi @m1hanick!
We found that this is triggered by the order in the data. In the table format, the logs are sorted by showing the last first and in the time series panel, they are shown sorted by the first. We will work on fixing this issue in the future but for now, you can use Sort by Transformation with Startvalue as a workaround.

54768

Tell us if it works for you please.

@eledobleefe eledobleefe added type/bug and removed needs investigation for unconfirmed bugs. use type/bug for confirmed bugs, even if they "need" more investigating labels Sep 16, 2022
@m1hanick
Copy link
Author

@eledobleefe hi, great thanks!!
your workaround does help

@natellium natellium added the team/grafana-dashboards Dashboards squad label Jun 23, 2023
@natellium natellium added the prio/future Used by the dashboards squad to prioritise their backlog label Aug 3, 2023
Sign up for free to join this conversation on GitHub. Already have an account? Sign in to comment
Labels
area/dashboard/data-links prio/future Used by the dashboards squad to prioritise their backlog team/grafana-dashboards Dashboards squad type/bug
Projects
Status: 📝 Backlog
Development

No branches or pull requests

4 participants