Skip to content
New issue

Have a question about this project? Sign up for a free GitHub account to open an issue and contact its maintainers and the community.

By clicking “Sign up for GitHub”, you agree to our terms of service and privacy statement. We’ll occasionally send you account related emails.

Already on GitHub? Sign in to your account

NO DATA alert is not firing #60283

Closed
Dhyanesh97 opened this issue Dec 14, 2022 · 4 comments
Closed

NO DATA alert is not firing #60283

Dhyanesh97 opened this issue Dec 14, 2022 · 4 comments

Comments

@Dhyanesh97
Copy link

What happened:
NO DATA alert is not firing. Also when we click on preview or run queries, it shows below error in grafana.

TypeError: e.fields[0] is undefined
ni@http://13.234.207.176:3000/public/build/AlertingRuleForm.e842a62c48a9802c4c89.js:145:386 div de@http://13.234.207.176:3000/public/build/2754.c9252327f51106ea3a6d.js:2:92534 li@http://13.234.207.176:3000/public/build/AlertingRuleForm.e842a62c48a9802c4c89.js:252:158 div de@http://13.234.207.176:3000/public/build/2754.c9252327f51106ea3a6d.js:2:92534 fieldset d@http://13.234.207.176:3000/public/build/2352.d7c14cbd3dbda648a17f.js:1406:1760 div div o@http://13.234.207.176:3000/public/build/2352.d7c14cbd3dbda648a17f.js:6337:172 bo@http://13.234.207.176:3000/public/build/AlertingRuleForm.e842a62c48a9802c4c89.js:292:2635 div div div t@http://13.234.207.176:3000/public/build/2754.c9252327f51106ea3a6d.js:2:711589 p@http://13.234.207.176:3000/public/build/2352.d7c14cbd3dbda648a17f.js:424:3558 div form R@http://13.234.207.176:3000/public/build/2754.c9252327f51106ea3a6d.js:2:927681 Co@http://13.234.207.176:3000/public/build/AlertingRuleForm.e842a62c48a9802c4c89.js:292:5768 Ro@http://13.234.207.176:3000/public/build/AlertingRuleForm.e842a62c48a9802c4c89.js:313:67 div 37417/b.Contents@http://13.234.207.176:3000/public/build/2352.d7c14cbd3dbda648a17f.js:5801:2272 div div div t@http://13.234.207.176:3000/public/build/2754.c9252327f51106ea3a6d.js:2:711589 p@http://13.234.207.176:3000/public/build/2352.d7c14cbd3dbda648a17f.js:424:3558 div b@http://13.234.207.176:3000/public/build/2352.d7c14cbd3dbda648a17f.js:5801:1289 t@http://13.234.207.176:3000/public/build/9076.637f4fd32666ef6824c7.js:1:211 69419/Mo<@http://13.234.207.176:3000/public/build/AlertingRuleForm.e842a62c48a9802c4c89.js:313:914 c@http://13.234.207.176:3000/public/build/2352.d7c14cbd3dbda648a17f.js:1207:301 u@http://13.234.207.176:3000/public/build/2352.d7c14cbd3dbda648a17f.js:1207:855 WithErrorBoundary Suspense c@http://13.234.207.176:3000/public/build/2352.d7c14cbd3dbda648a17f.js:1207:301 _c@http://13.234.207.176:3000/public/build/2352.d7c14cbd3dbda648a17f.js:8832:350 t@http://13.234.207.176:3000/public/build/2754.c9252327f51106ea3a6d.js:2:1060624 t@http://13.234.207.176:3000/public/build/2754.c9252327f51106ea3a6d.js:2:1062645 main Cd@http://13.234.207.176:3000/public/build/2352.d7c14cbd3dbda648a17f.js:8793:6823 t@http://13.234.207.176:3000/public/build/2754.c9252327f51106ea3a6d.js:2:1057242 div o@http://13.234.207.176:3000/public/build/2352.d7c14cbd3dbda648a17f.js:1996:4308 19175/t.KBarProvider@http://13.234.207.176:3000/public/build/2754.c9252327f51106ea3a6d.js:2:271053 l@http://13.234.207.176:3000/public/build/2352.d7c14cbd3dbda648a17f.js:6145:19549 c@http://13.234.207.176:3000/public/build/2352.d7c14cbd3dbda648a17f.js:1207:301 u@http://13.234.207.176:3000/public/build/2352.d7c14cbd3dbda648a17f.js:1207:855 l@http://13.234.207.176:3000/public/build/2754.c9252327f51106ea3a6d.js:2:1040274 bu@http://13.234.207.176:3000/public/build/2352.d7c14cbd3dbda648a17f.js:8845:115

What you expected to happen:
Alerts should be sent without any errors. We should able to preview the alert in case of NO DATA.
In earlier version we haven't experienced this issue.

How to reproduce it (as minimally and precisely as possible):
Use below grafana docker images:
grafana/grafana:9.3.1-ubuntu
grafana/grafana:9.3.0-ubuntu

Configure alert which returns no data.

Anything else we need to know?:

Environment:

  • Grafana version: 9.3.1 and 9.3.0
  • Data source type & version: InfluxDb 2.0
  • OS Grafana is installed on: ubuntu 20.0
  • User OS & Browser: Windows - Forefox
  • Grafana plugins:
  • Others:
@mellieA
Copy link
Contributor

mellieA commented Dec 14, 2022

@Dhyanesh97 there's an issue reported here that walks through the way that NO DATA is evaluated. The issue talks about how the results of NO DATA aren't behaving as expected.

Can you share a screenshot or example of the alert condition you're evaluating? I saw the error you reported, what does the query result look like for the same datasource in Explore?

@mellieA mellieA added the needs more info Issue needs more information, like query results, dashboard or panel json, grafana version etc label Dec 14, 2022
@Dhyanesh97
Copy link
Author

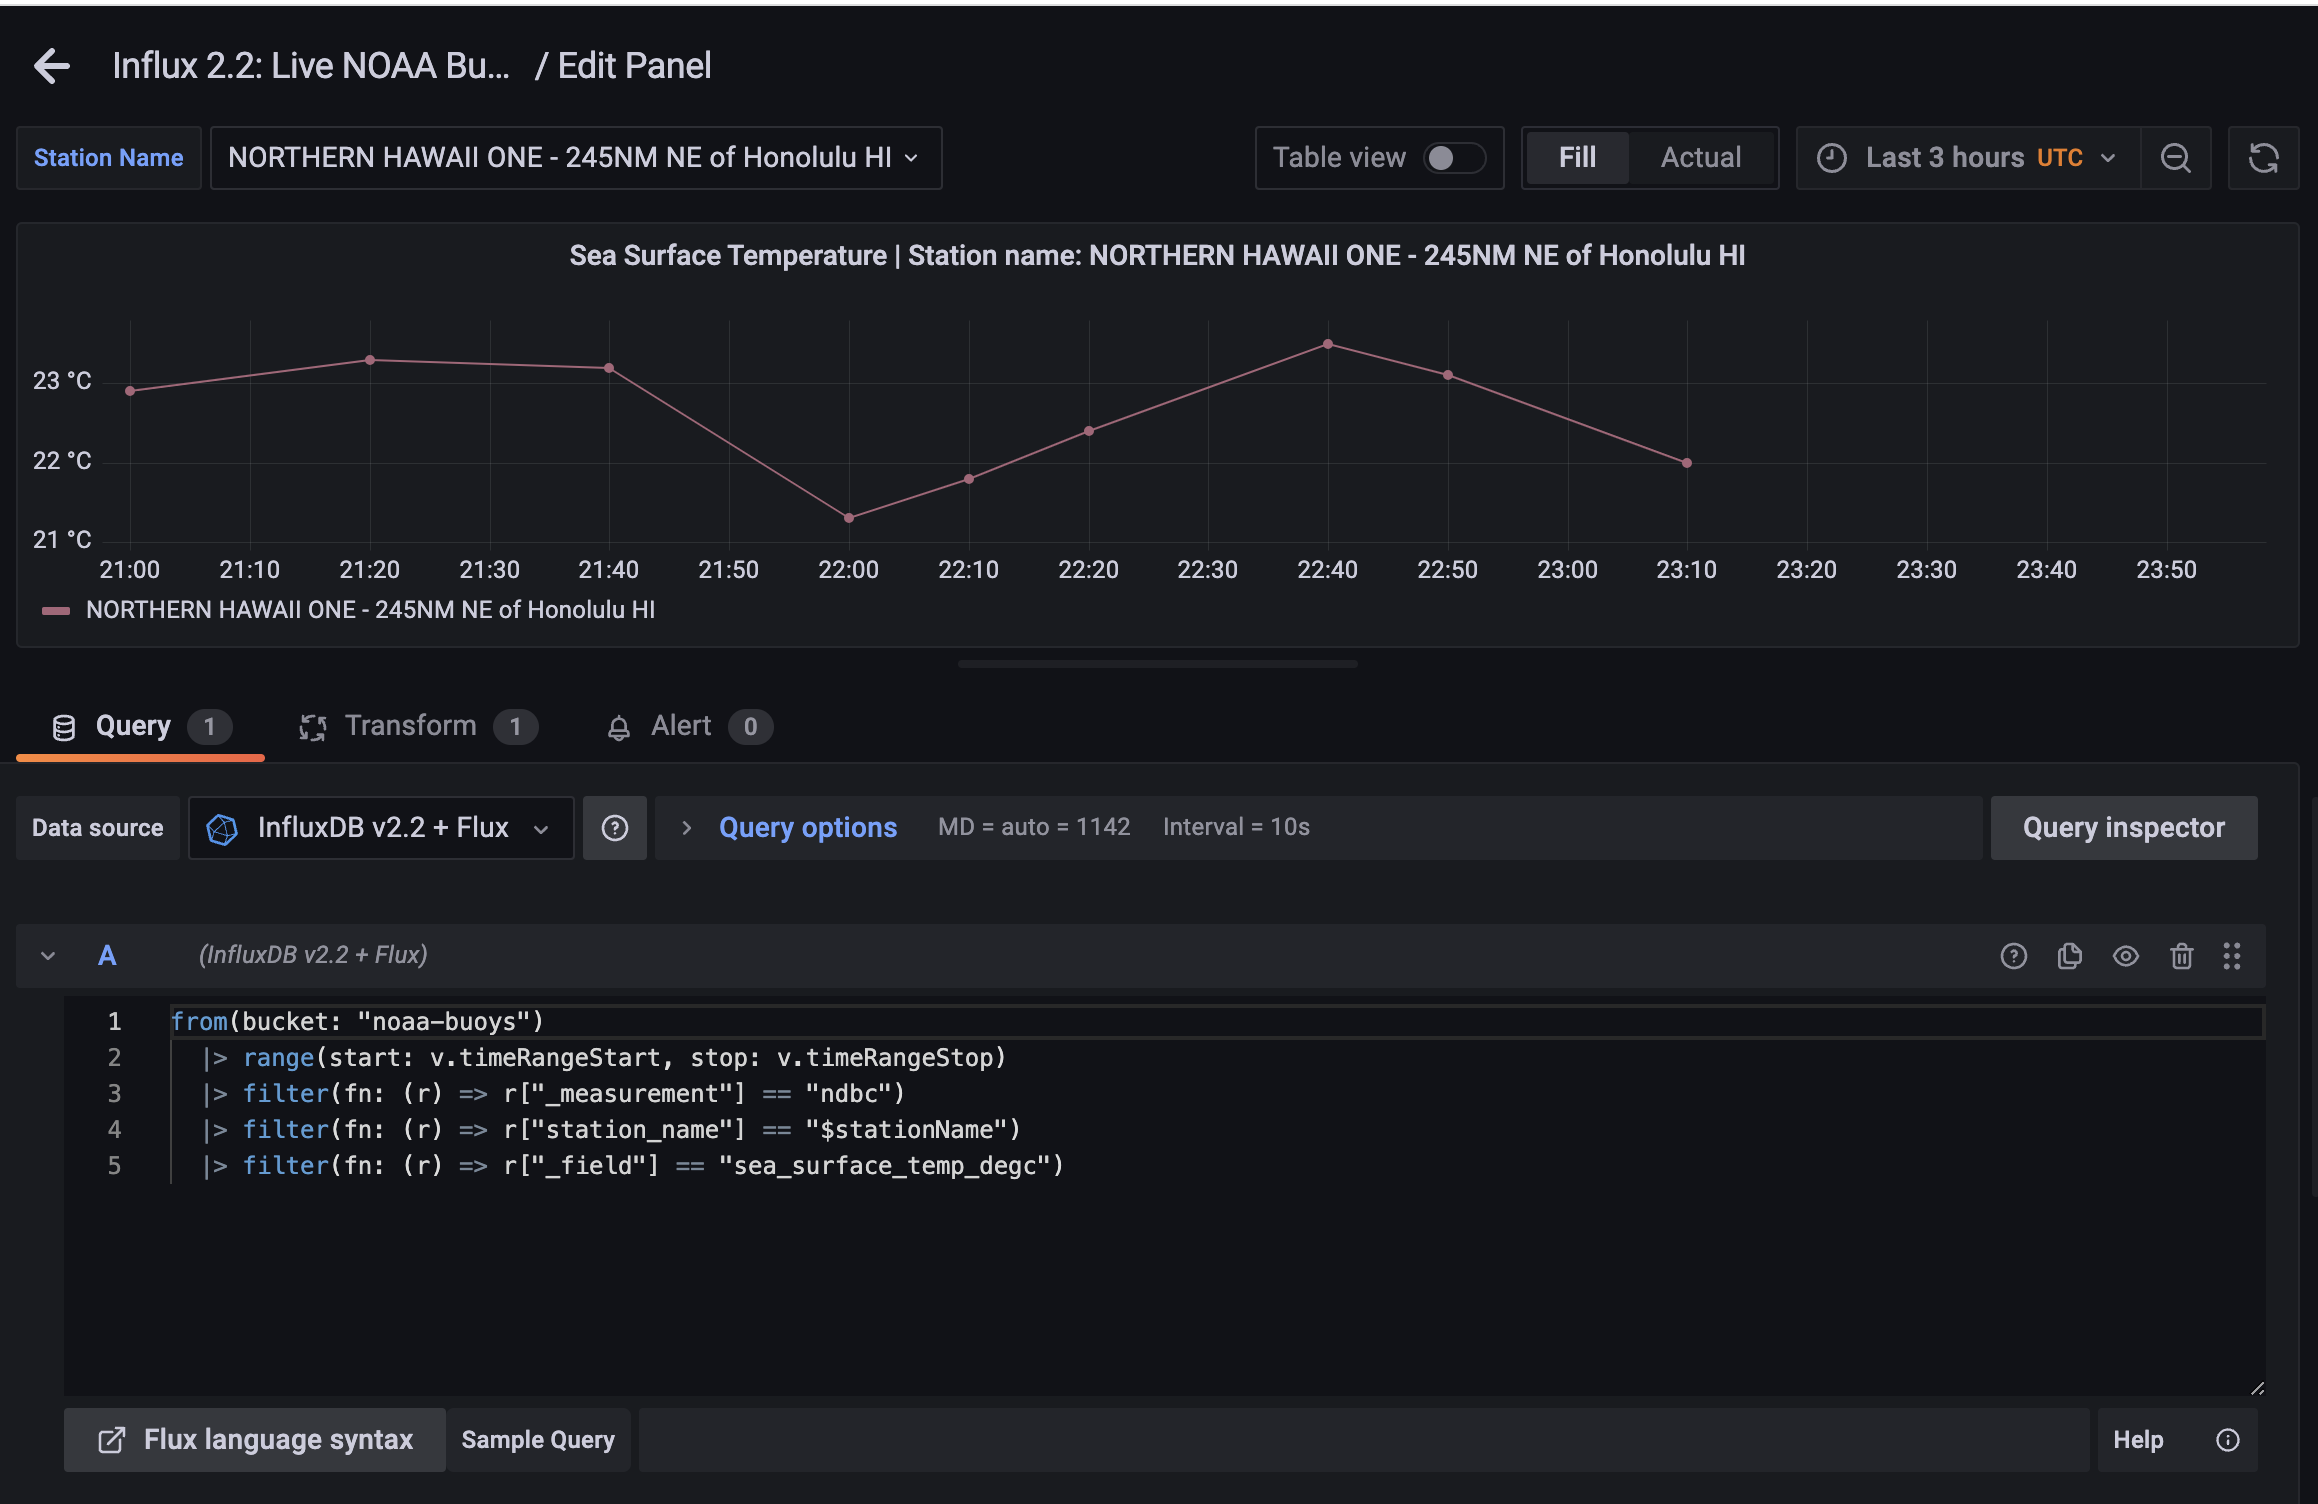
@mellieA It is normal query to get the field data. please find query below.

from(bucket: "bucket_name")
  |> range(start: v.timeRangeStart,stop: v.timeRangeStop)
  |> filter(fn: (r) => r["_measurement"] == "measurement_name")
  |> filter(fn: (r) => r["tag_1"] == "1")
  |> filter(fn: (r) => r["_field"] == "field_name")

When query returns no data, grafana is throwing an error. We can see the error in UI as well.
Due to this error we downgraded grafana version to 9.2.7

image

@mellieA
Copy link
Contributor

mellieA commented Dec 21, 2022

@Dhyanesh97 I was able to reproduce this with test data that we have on play.grafana.org. Thank you for the extra information, I've routed this over to the alerting squad to take a look

There is data in this panel for the last three hours, but nothing in the past 30 minutes:

https://play.grafana.org/d/2N0n0Er7k/influx-2-2-live-noaa-buoy-data?orgId=1&editPanel=5&from=now-3h&to=now

Screenshot 2022-12-20 at 4 58 54 PM

When I copy this same query and try to use it as an alert condition. This works because there is data in the past 3 hours:

Screenshot 2022-12-20 at 5 01 29 PM

Change the time range to last 15 minutes:

Screenshot 2022-12-20 at 5 02 27 PM

Click preview and the page errors:

Screenshot 2022-12-20 at 5 03 08 PM

@mellieA mellieA added datasource/InfluxDB area/alerting/evaluation Issues when evaluating alerts type/bug and removed needs more info Issue needs more information, like query results, dashboard or panel json, grafana version etc labels Dec 21, 2022
@gillesdemey
Copy link
Member

This should be fixed by #61814 and will be in the next Grafana release.

Sign up for free to join this conversation on GitHub. Already have an account? Sign in to comment
Projects
Archived in project
Development

No branches or pull requests

5 participants