No data points in direct rendered image #9447
Comments
|
what is your datasource and how does grafana access it? For server side rendered images grafana-server needs to be able to access the url you specified in data source settings. Since your using docker, maybe the docker container has no network access to the data source? |
|
@torkelo Just awesome, you pointed me to my exact problem! |
|
But one thing.. why in this case there are no connection errors in the logfiles? |
|
Please give me more information about "So I've changed the data source to use the docker-container name rather than "localhost" and now everything works as expected.". I got logs: t=2018-11-12T10:56:43+0000 lvl=dbug msg="Phantomjs output" logger=rendering out="Loading a web page: https://localhost:3000/d-solo/WYjho9aiz/test-ondra?panelId=4&render=1 And I got in email alert notification only: I also think, that problem is on connection but don't know where. |
|
@ondrejFuchs Puh, that's already more than a year ago. As I recall correctly my |
|
Any advice how can i check it? I have also setting influxdb as localhost (run in docker). If I add new datasource in grafana, I settup it like: https://<my_ul>:8086. For example https://test.com:8086 and it work perfect but not in pictures in email notification. |
|
Did you verify if your grafana container can access the URL from within the container? |
|
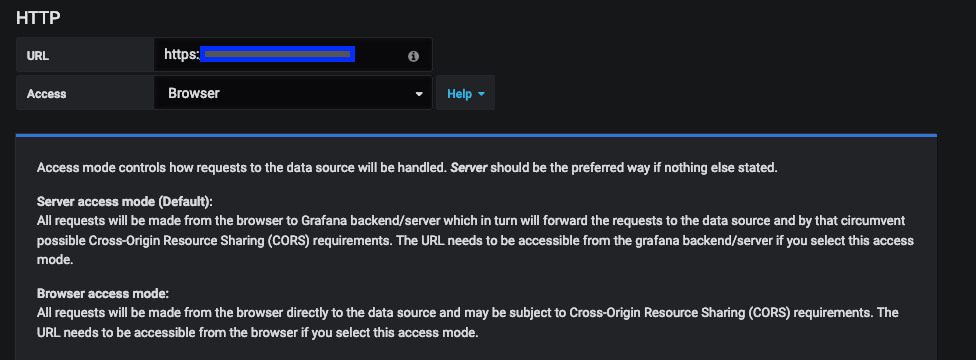
Just in case someone with a similar issue to me finds this: I'm running grafana and prometheus in docker, but grafana is connecting to prometheus through nginx w/ https via letsencrypt. Like OP, dashboards worked fine, but direct rendered image gave me this red exclamation point with no data. I had to edit my data source and switch it from
|
I am using Grafana (v4.5.2) with Docker (version 17.06.2-ce) on an Ubuntu machine (17.04 zesty).
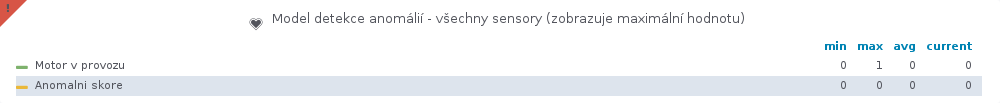
I have configured a dashboard that is working quite well:
But when I try to use share->Direct link rendered image I get following png:
I already played around with some configurations like root_url with no success.
I doubt that I have font issues, since everything else is just rendered fine.
There is a red exclamation mark on the very top left corner of the rendered image. But, since it's just an image, I don't know what this is about, because the logs do not display any issues neither..
So does anyone has a clue why I don't see any datapoints?
Regards,
Christopher
The text was updated successfully, but these errors were encountered: