x-ray data source variable binding not working for Trace List query parameter #131
Assignees

Labels
Comments
|
Hi @chandermani , thanks for reporting this issue! I've reproduced it and am currently investigating it. |
Sign up for free
to join this conversation on GitHub.
Already have an account?
Sign in to comment
What happened:
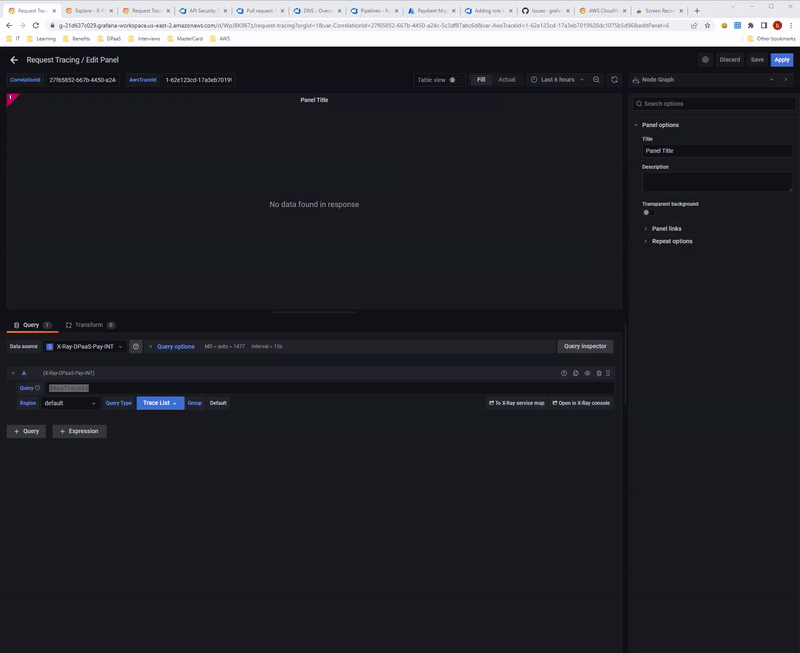
Grafana x-ray data source does not behave correctly when selecting Trace List and using a dashboard variable. It does not filter the trace list.
If we directly put the traceId it works fine. It seems variable interpolation is causing a different AWS query to be called (
getTraceSummary) as described in the screen recording and below screenshotWhat you expected to happen:
Grafana x-ray data source should have used the dashboard variable to query a single trace and render the graph.
How to reproduce it (as minimally and precisely as possible):
Anything else we need to know?:
Environment:
The text was updated successfully, but these errors were encountered: