dashboard: add code status rate and apdex, improvement checks, update… #98
Conversation
… readme, add new samples
Co-authored-by: Ivan <2103732+codebien@users.noreply.github.com>
Co-authored-by: Ivan <2103732+codebien@users.noreply.github.com>
|
Hey @jwcastillo, @ppcano I assigned you as a reviewer so we have more opinions here |
|
Nice job, @jwcastillo. I doubt whether to include the Apdex metric or not. Neither Grafana pre-built dashboards nor k6 Cloud present the Apdex score by default. Initially, we aim for consistency across OSS and commercial dashboards. @dgzlopes, wdyt? |
|
Yeah, lovely PR! Thanks for the work ❤️
I fully agree, it feels a bit out of place in this dashboard 👍 |
|
Ok I put it in a separate dashboard, like the custom metrics example |
|
Looks awesome! |
There was a problem hiding this comment.
@jwcastillo thanks.
I would prefer if we replace the image prometheus-dashboard-k6-test-result.png with the image we use for prometheus-dashboard-k6-test-result-performance.png. It is nice to have an overview of the dashboard but I don't think we need so many details.
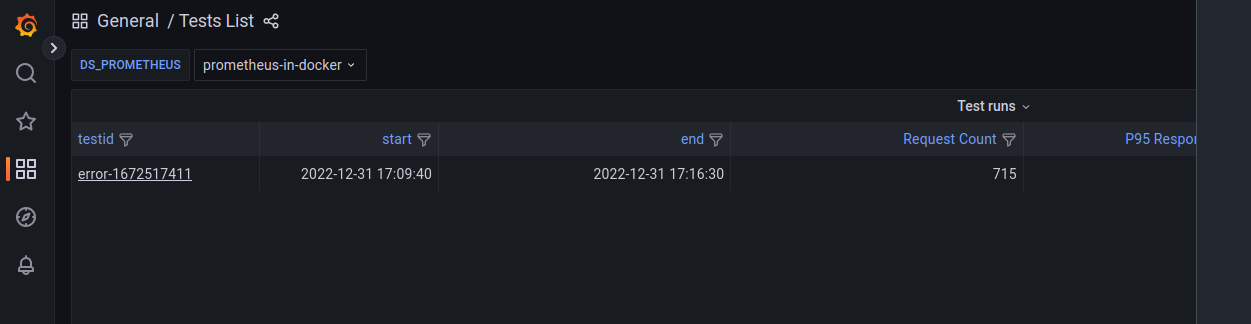
Same for The board is structured into 4 sections section, I'm for removing it, instead for the Test List I think we should crop the image to something similar to:
README.md
Outdated
| The board is structured into 4 sections | ||
|
|
||
| #### Apex Overview | ||
| #### Performance Overview | ||
|
|
||
| [<img src="./images/prometheus-dashboard-k6-test-result-performance.png" width="500"/>](./images/prometheus-dashboard-k6-test-result-performance.png) | ||
|
|
||
| #### HTTP | ||
|
|
||
| [<img src="./images/prometheus-dashboard-k6-test-result-http.png" width="500"/>](./images/prometheus-dashboard-k6-test-result-http.png) | ||
|
|
||
| #### Scenarios | ||
|
|
||
| [<img src="./images/prometheus-dashboard-k6-test-result-scenarios.png" width="500"/>](./images/prometheus-dashboard-k6-test-result-scenarios.png) | ||
|
|
||
| ### Test list dashboard | ||
|
|
||
| [<img src="./images/prometheus-dashboard-k6-test-runs.png" width="500"/>](./images/prometheus-dashboard-k6-test-runs.png) |
There was a problem hiding this comment.
I don't think we need these details in the README. The performance overview should be enough as the screenshot for the Test result dashboard.
|
I think we shouldn't document the dashboards here. It would be better if we update the official doc. I think in this repo we should only document stuff specifically for the extension, all the rest should stay on the k6-docs. I would open a PR to drop all the current text of the README and structure a list of links plus the specific info for the extension. Similar to what @MattDodsonEnglish did for https://github.com/grafana/k6/blob/master/README.md. @ppcano @javaducky WDYT? |
|
@codebien If the dashboards are now ready, I suggest merging the PR and we'll update the readme and the docs. |
new dashboard version
add:
update:
remove: