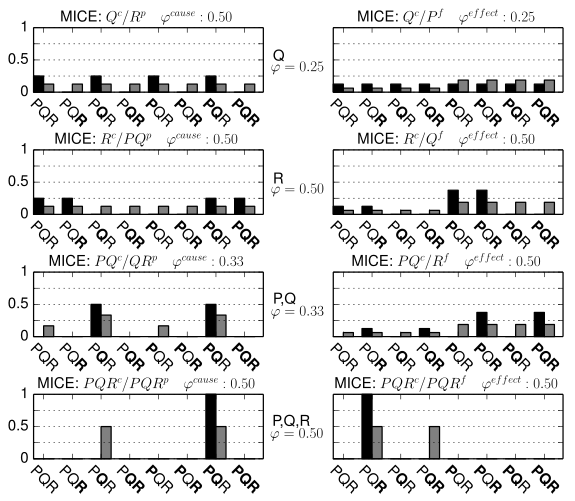
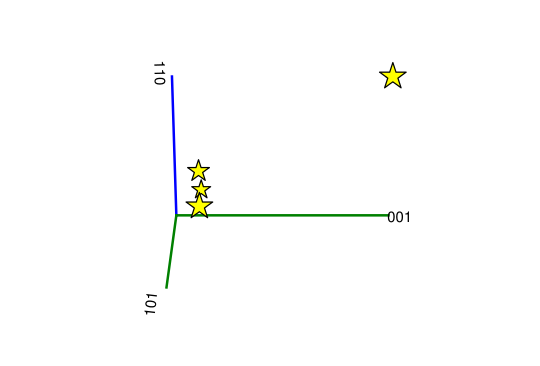
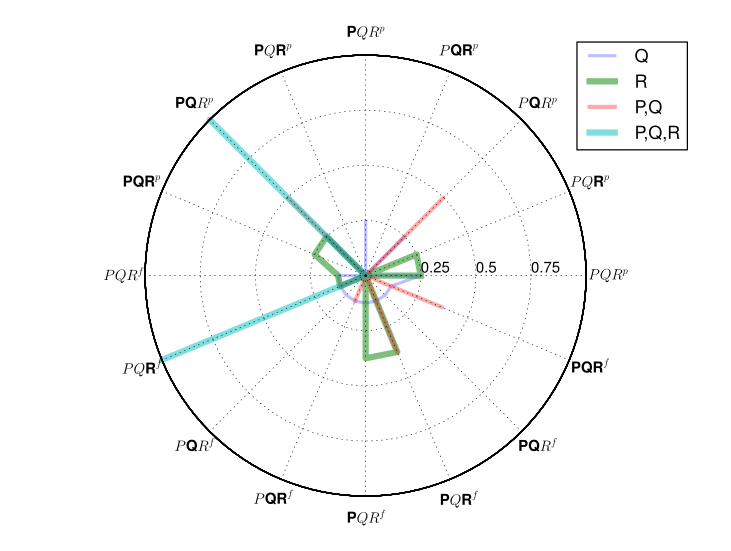
Python tools for plotting Integrated Information Theory figures.
This package depends on matplotlib. Unfortunately, Matplotlib depends on
non-Python libraries, so pip won't install it on Linux. You must do this
yourself: sudo apt-get install python3-matplotlib.
Afterwards, you can: pip3 install phiplot.
All text is rendered in latex, so you will also need a tex distribution, and it will need to have all the various packages used by matplotlib. On Ubuntu:
sudo apt-get install texlive-latex-extra
sudo apt-get install texlive-fonts-recommended
sudo apt-get install dvipng
OS X pip can distribute the binaries matplotlib depends on just fine:
pip3 install matplotlib
pip3 install phiplot
Because matplotlib depends heavily on certain GUI frameworks which do not play nicely with pip, it is hard to install in a virtual environment. You may have to settle for installing it system-wide (i.e. as a site-package), and then tell venv to inherit site-packages:
# Using virtualenvwrapper...
mkvirtualenv --python=`which python3` --system-site-packages your_venv_name


