In this work, we conducted a systematic literature mapping to summarize the knowledge regarding the migration of legacy systems to the cloud. Additionally, we performed an exploratory analysis of discussions on Stack Overflow and other question-and-answer communities within the Stack Exchange network to gather professionals' perspectives on this topic and compare these perspectives with the knowledge found in the literature. The contributions of this study include identifying trends, patterns, advancements, gaps, challenges, and opportunities in the field of legacy system migration as reported in the literature. Most importantly, we developed a proof of concept for a decision support software tool using a Large Language Model (LLM) that provides targeted responses to questions about migrating legacy systems to the cloud, enhanced by the Retrieval-Augmented Generation (RAG) method.
- What are the challenges in migrating traditional systems to the cloud?
- What are the opportunities in migrating traditional systems to the cloud?
- What is the developer's perspective about the migration process?
This proof of concept (PoC) project assists professionals in migrating legacy systems. The architecture involves two main components:
The LLM (Llama 2) is enhanced using the Retrieval-Augmented Generation (RAG) method, which retrieves relevant content from external studies to provide more accurate responses without altering the model's core.
A web-based Q&A system is developed where users submit questions. These questions are processed by an API that utilizes the enhanced LLM to deliver precise and relevant responses, aiding in legacy system migration.
to see more about the poc click here
The proposed topics modeling groups the most discussed topics in the studies included in the mapping into six clusters. We use the tool LDAvis.
Cluster 1 predominates, focusing on general migration to cloud issues. Next, we have cluster 2, which addresses technical topics such as coding issues, databases, networking, and more. Cluster 3 focuses on the migration process and metrics, including objectives, means, and performance evaluation. Clusters 4 and 5, due to the inter-topic distance, can be considered as a group of topics that deal with this business part, business risks, etc. Cluster 6 focuses on agile methodologies and software engineering in the cloud context.
to see more about the topics modeling click here
This folder contains all the data resulting from the study:
Legacy-Migration-to-Cloud-Papers.xlsx: Table with the articles included and the data extraction processes for these articles. Contains the article ID and other information such as publication year, author, place of publication. It also contains the categories used in the extraction process and the results.Stack-Exchange-Exploratory-Analysis-Results.xlsx: Table with all queries performed on Stack Exchange Data Explorer. Contains the ID, search strategy, parameters and link to reproduce.
This folder contains the relevant documents of the study:
SystematicMappingProtocol.pdf: The Systematic Literature Mapping protocol. Contains the objectives, methods and inclusion and exclusion criteria of the study.
This folder contains all the visualizations used or mentioned in the article from our study:
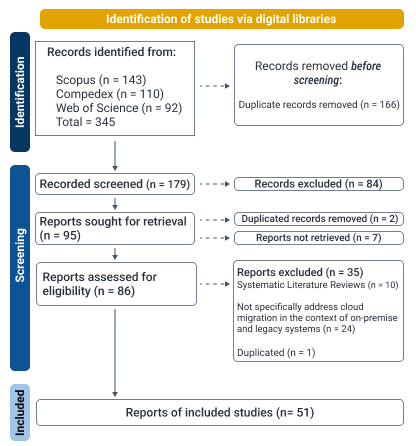
PICO.png: The figure shows the implementation of the PICO methodology used in this work.PRISMA.png: The figure shows the implementation of the PRISMA methodology used in the systematic mapping of this work.fig1-systematic-mapping-method.pdf: The figure shows the processes that underpinned the systematic mapping of this study.fig2-year-count.pdf: The figure shows a bar graph of the number of articles published per year.fig3-research-contribution-empirical.pdf: The figure presents three (3) bar graphs. Graph (a) considers the number of contribution types. Graph (b) considers the number of empirical validations. Graph (c) considers the number of research types.fig4-topics-mapped.pdf: The figure shows the visualization of topic modeling in the LDAVis tool.fig5-challenges-and-opportunities.pdf: The figure presents two (2) bar graphs. Graph (a) presents the number of challenges for the ten (10) established categories. Graph (b) presents the number of opportunities for the eight (8) established categories.heat-map-of-publications-per-year.pdf: The figure shows a heat map of the number of articles published considering the location of the first author's affiliation.
This folder contains all tables used or mentioned in the article from our study:
table1-search-string-dabases.xlsx: The table of variations of the search string applied in each digital library chosen in the study.

