
note: MARK: Welcome everyone, happy to have you all here. By the dancing trees you can see we're about to take a trip to SVG Island. This presentation isn't focused on a specific Elixir topic but instead takes you on our journey of developing custom SVG charts for use in Phoenix LiveViews. Let's get started.
| Mark Keele | Meks McClure |
|---|---|
| he/him | they/them |
 |
 |
| https://keele.codes/ | github: MMcClure11 |
notes:
MEKS: Hello all! I’m Meks. I use they/them pronouns and my counterpart here is Mark (he/him). We are both software engineers at GridPoint working on separate teams, but partnered up to explore SVG island together.
notes:
MARK: Why explore SVG Island? Well we have a lot of data that we need to visualize. We have top notch designers and they have dreamed up several creative ways to best inform our customers. With these design challenges we need a robust charting solution to bring these visualizations to life.

notes:
MARK: Here's an example of a bar chart from design. Wow, what a beauty. I'm going to break down this chart and try to convey its complexity. First off we have a multi-series chart meaning that for every x value we have several y values. These are colored bars you see which need to be colored individually and have the ability to swap color palettes for different datasets. We also need to support gaps in our dataset which you can see by the greyed out months. The final elements are the y labels and the corresponding background line for each. To top it off this is just one chart type we need to support.
Rule Number 1 No JavaScript 🔥
- Avoid adding node dependency
- Simplify deployments
- Hooks can become complicated
notes:
MEKS: Before starting, let’s lay some ground rules. Our project has no JS dependencies outside of the built in LiveView JS library. Adding a JS dependency would mean that we need to include node as part of our release process. Ideally, we want to stick to erlang and the BEAM without having to add anything else to our servers. This helps simplify deployments. Drawing on prior experience, writing JS hooks for use in Phoenix can become very complicated, very quickly. We want to avoid that as well, sticking with what we know best, Elixir. So our first rule is, no JavaScript!
Rule Number 2 No JavaScript 🔥
notes:
MEKS: Rule number 2, no JavaScript!
MARK: Ok, point taken.
notes:
MARK: Given the no JavaScript constraint we're only considering pure elixir solutions. Unfortunately there's no D3.js equivalent in the Elixir community. After looking around to see what's our there we decided to try out Contex and GGity. VegaLite was another one and if you're familiar with LiveBook you've probably seen its snazzy visualizations. VegaLite only works with LiveBook and does have a JS dependency so let's take a closer look at our other options.
- Most popular pure Elixir charting library
- Support for many chart types
- Works well with LiveView
notes:
MARK: Contex is the most popular pure Elixir charting library. It supports bar chart, line plots, and even plays nicely with LiveView. It supports multi-series charts which was a requirement for us.
- Documentation
- Output SVG is complex
- No clear way to meet our design goals
notes:
MARK: The downsides were the sparse documentation, complexity of the output SVG, and there was no clear way to meet our design goals.
- Based on R's ggplot2 API with great documentation
- Works well with LiveView
- Support for many chart types
notes:
MARK: GGity is quite interesting as it's based on R's ggplot2 which folks in the scientific community might be aware of. It has great documentation, works well with LiveView and has support for the chart types we need.
- API is less intuitive an Contex's
- Styling is more "scientific" looking
- No clear way to meet our design goals
notes:
MARK: The downsides were the API is a bit difficult to comprehend, the charts are very "scientific" looking, and there was no clear way to meet our design goals.
- Both libraries build data structures that in turn generate SVG charts
- We could alter data structures to meet our goals
- We could overwrite the output SVG to meet our goals
notes:
MEKS: While these libraries provide the charts we need, they lack the customization desired to achieve our design goals. They both build data structures that the SVG is generated from, but advanced customization would require us to alter the data structures or overwrite the generated SVGs, neither of which is ideal.
- Build it ourselves.
notes:
MEKS: Our conclusion was that it would take more time and effort (in development and maintenance) to retrofit these charting libraries to our visualization needs rather than simply doing it ourselves. Which brings us to...(flip to next slide)
notes:
MESK: SVG Island! This is where Mark and I journeyed together to see what visualization treasures we could find.
- SVG: Markup language for describing two-dimensional based vector graphics.
- Vector Graphic: Visual images created from geometric shapes on a Cartesian plane
- Element: Used to create drawings and images.
- Attribute: Used to modify how an element should be handled or rendered.
- An SVG Primer for the curious.
notes:
MARK: Hey Meks, what exactly is an SVG?
MEKS: At a high level, SVG, or Scalable Vector Graphic, is a markup language for describing 2 dimensional vector graphics. Vector graphics is a form of computer graphics in which visual images are created directly from geometric shapes such as points, lines, curves and polygons. Elements such as polyline and text are used together to create visuals. Attributes such as fill and stroke modify those elements.
notes:
MEKS: Now that we we’ve looked at a high level map of SVG Island, let’s start exploring its geography in closer detail and see how SVGs are put together.
Defines the position and dimension of an SVG viewport.


MARK: The viewbox is our playground and the space we'll work in to draw SVGs. Here I've defined a viewbox with an origin point of 0,0 and an arbitary width and height. I've used my browsers inspect here to outline the viewbox.


notes:
MARK: While working with SVGs it can be helpful to use rectangles to outline the space you're working in.
Here I've used the rectangle element with 100% width and height to actually SEE the viewbox. Internally we called this "debug mode" and used this outlining strategy as we added elements to the SVG.
This is the IO.inspect of SVG.
notes:
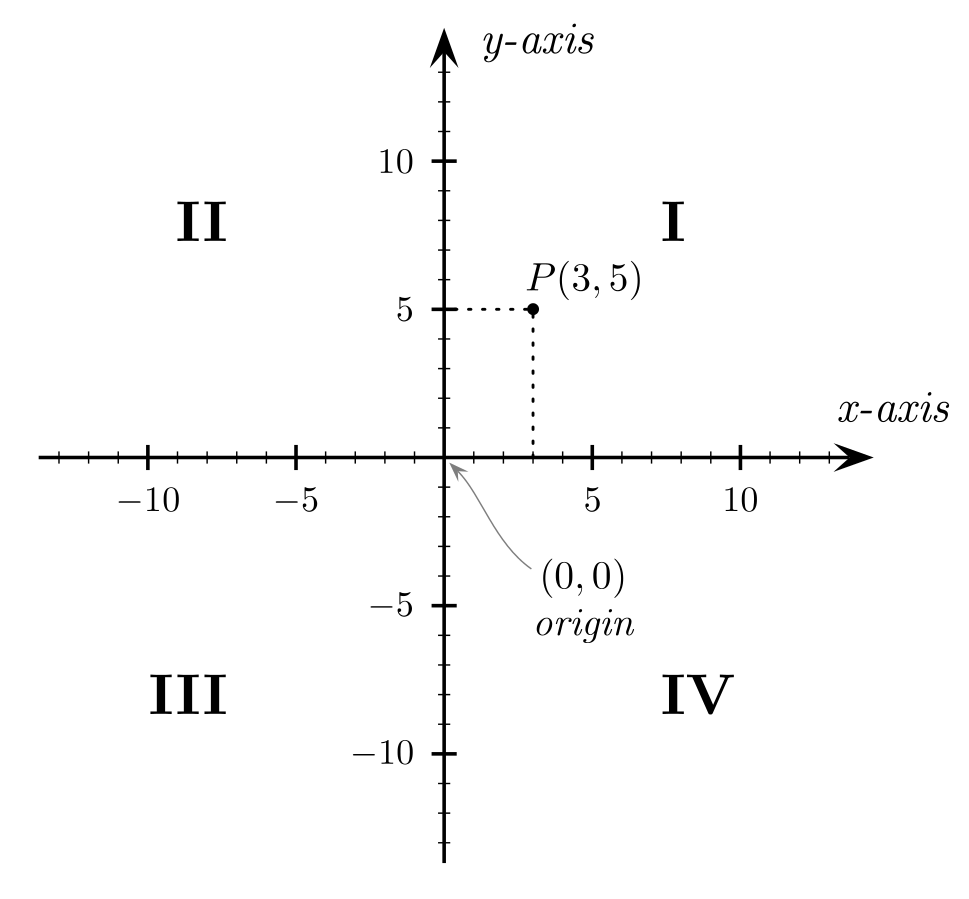
MEKS: If we think back to our school days, many of us probably studied Geometry and the Cartesian coordinate system.
The top right quadrant, positive x, positive y, is the quadrant applicable to SVG creation. This is how the vector graphics are created, by drawing shapes using a coordinate system.
Note the origin (0, 0) is in the bottom left corner of quadrant 1.

notes:
MEKS: The SVG coordinate system is similar to quadrant 1 of the Cartesian system except the origin (0,0) is in the top left corner.
The y-axis is reversed compared to a normal graphs. As y increases in SVG, the points, shapes etc. move down, not up.
This was one of the most challenging parts of building our own charts and I regularly had to stop and think about this. It really helped to pause and perform the mental gymnastics of visualizing what the chart needed to look like and flipping it upside down.
Polyline: Creates straight lines connecting several points.


notes:
MARK: Polyline is our main SVG element and what we'll use to draw the chart. Polyline works by accepting a list of x,y coordinates which it then connects together to form a line. Polyline accepts an arbitary number of points but more on that later. Here I'm using a Polyline to draw a line from the bottom of the viewbox to the top of the viewbox.
Text: draws a graphics element consisting of text.

notes:
MARK: We're also gonna need the text element in order to add labels or other text to our chart.
Text works by adding a box of text at the given x, y coordinate.
notes:
MEKS: Now that we have explored SVG island a bit and have the basics down, lets test out our new survival skills and build a line chart.
notes:
MARK: Meks, I have a challenge for you.
MEKS: You do?
MARK: Yeah.
MEKS: Ok. What is it?
MARK: Explain to me how to draw a straight line. Pretend I am 5 years old, have never drawn a straight line before, and am using pen and paper.
MEKS: Really?
MARK: It’ll make sense, trust me.

notes:
MEKS: Ok, one way that comes to mind is that you pick a point to start at. Press your pen to the paper, drag your pen horizontally across the paper, and lift up your pen from the paper when the line is as long as you want.

notes:
MARK: Like this?
MEKS: Yeah, that’s a straight line.
MARK: Nice!
notes:
MARK: I have another challenge.
MEKS: Bring it on.
MARK: How would I draw a capital ”M“. Explain it to me like I’m 5, have only ever drawn a straight line before, and am using pen and paper.
MEKS: That’s a bit harder, but if we use the concept established with how we can draw a straight line, it’s not so bad.

notes:
MEKS: Pick a point to start at the bottom of the M. Extend the line to the height of the M with a slight slant to the right. From the end of the first line, draw a line downwards that's half the height of the first line. From the end of the second line, draw a line that rises half the height of the letter M. From the end of the third line, draw a line downwards that's the height of the letter M with a slight slant to the right.

notes:
MARK: Like that?
MEKS: Yup! Looks like an M do me. Did you pick M because both our names start with that letter?
MARK: Next slide...
notes:
MARK: I have a final challenge. Last one I promise. Explain to me how to draw a line chart. I’m 5 years old, have only drawn an M before, and I’m using pen and paper.

notes:
MEKS: Let’s start the first line down where the 18k is. Put your pen to the paper at that point, and drag upward at a slight right angle and stop at around 64k. Starting where you ended the previous line, draw a new line upwards and stop at 72k. Starting where you ended that line, draw another one down to 64k. We would keep repeating this process for all the points we want to mark on the line chart.

notes:
MARK: Like so?
MEKS: Yup! That’s a line chart! I think I see where you are going with this.
notes:
MARK: So what was the point of that exercise?
notes:
Meks: We have many points, and we connect them!
Mark: Really?
Meks: Sorry, bad pun, I couldn’t help myself.
- Constrain polyline to only accept 2 points

notes:
MEKS: The first important take away is that we have two points, the start and the end of the line.
This is important for our use case because we constrain the use of the polyline to only accept two points. We do this by creating a functional component that accepts exactly two sets of x and y coordinates. This was a conscious choice we made because then each line segment represents a piece of data that we can interact with.
- Utilize last known location to keep drawing more lines

notes:
MARK: The second important take away is that we utilize the end of the previous line to start the next line. In the code example above you can see that we iterate over our dataset and generate coordinates for each data point. We use the end of the previous line as the start of the next line. While the end of the next line is a product of scaling the new data point to the chart dimensions. The result is we calculate a list of line coordinates were each line represents a data point in our dataset.

notes:
MEKS: Most of us are probably familiar with Hex packages and have seen their download charts. We built a small demo app with the aim of replicating the Jason downloads chart. This demo is available publicly and we’ll provide the link at the end of the presentation so interested parties can peruse the code. It’s ReadMe has a copy of this slide deck as well.


notes:
MEKS: What you see here on the screen is a hand built SVG replica. Every part was built using either polylines, or text elements. We took the data from the original chart, ran it through a transformation to create a list of structs that has the x and y coordinates for each line segment. To generate the coordinates we rely on important takeaway #2 of our line drawing exercise: using the previous line’s end coordinates as the start of the current line. We also use the dimensions of the SVG viewport to scale and determine the coordinates of the end of the line.

notes:
MEKS: Here is that same chart, but with styling applied. All this is done with just the required svg points attribute for the polyline and Tailwind CSS classes!
- JIT: “just-in-time” compiler
- Add arbitrary values: class="stroke-[3]"
- Add additional CSS attributes: class="[stroke-linecap:round]"
notes:
MEKS: As a brief intro to Tailwind, it is a utility-first CSS framework that can be used without leaving your HTML or Phoenix HEEX templates. One of Tailwind's newer features is the "just-in-time" compiler which we take advantage of here to style SVG elements. The JIT generates styles on-demand instead of generating everything in advance at initial build time. This allows us to add arbitrary values and styles without writing custom CSS.

notes:
MEKS: For the lines of the chart, we use this feature to style the SVG attributes of stroke width and the stroke linecap. Since Tailwind has the stroke width attribute, we can use the square bracket notation to tell it to have an arbitrary value of 3px. Stroke-linecap describes how the end of the line should look. A value of round gives us that nice connection between the polylines. But, stroke-linecap doesn’t exist in the Tailwind library, so we can again use the square bracket notation to inline additional CSS.


notes:
MEKS: Here you can see how straight forward it is to just switch out a few values to change the line width, opacity, and linecaps. A big advantage with this is that we didn’t have to leave the LiveView to go and write vanilla CSS in another file. This helped significantly with code readability and maintainability since we were able to exclusively use inline Tailwind for styling.

notes:
MEKS: So we have pretty well established how to draw lines in relation to each other and the dimensions of the viewbox. We also know how to style them, but what about the text elements like the labels and the legend? Let’s look at the legend to see how we can position that.


notes:
MEKS: Here we have a small functional component where we can pass it the coordinates and value of the text for the legend. We’ll use the chart width and height to determine its placement.
Remember, SVG charts are upside down, so to place it in the upper most part of the chart, we just use y=0. We can pass x={@chart.dimensions.chart_width} for its x coordinate.

notes:
MARK: Wait, where’s the legend?
MEKS: The legend is outside the bounds of the viewbox. We can “see” it with the browser inspect.
Turning on debug mode to see the outline of the viewbox helps us get a better idea of its positioning and why we can’t see it.
When you set coordinates to position SVG text, you’re setting the location of the left edge of the text and the baseline of the font.
So that means the bottom of the text is at y=0 and the left edge is at the width of the viewbox.
We can fix this by giving it some magic numbers and make its origin not the full width of the viewbox and remembering that to move it down we need to increase its y value.


notes:
MARK: While this works, it’s not ideal since that position will need to change based on the contents of the text element. It would be nice for the component to be more flexible. Meks, can we do away with those magic numbers?


https://bit.ly/3PbPTqH: Blog series on SVG text.
notes:
MEKS: Well, Mark. With Tailwind, we can! Once again, we rely on the just-in-time compiler and add some SVG attribute references that the Tailwind library doesn’t contain; dominant-baseline and text-anchor. We can change the text location relative to the coordinate with these SVG specific attributes. Setting the dominant-baseline attribute to hanging, moves the text below the baseline which is at y=0. Then to move the text to the left and we can use text-anchor which lets us align the text horizontally. By giving it “end”, we’re telling it to align the end of the text with the coordinate we gave it.


notes:
MEKS: Now that we have a better understanding of how the line chart was built and styled, let’s get into some of the LiveView functionality. Going back to our download chart, if you recall, we constrained our polylines to only have 2 points. What this allows us to do is interact with each line. We can add phx-click and click-away events to each polyline. The event handlers set the tooltip assigns and will display or hide the value from the dataset at the line’s end point.

notes:
MARK: Next you might be wondering, what about updating the chart with new data? Well updating a chart is no different than any other update we'd do with LiveView. The above example is showing what it looks like to update the chart with socket assigns. When we receive a new data point the coordinates are generated for it then added to the socket assigns.
MEKS: It's quite hard to tell but on each update there's a roundtrip to the server and an entire redraw of the chart. Mark, is there a way we could just add the new data point without redrawing the whole chart?

notes:
MARK: Here come LiveView Streams to the rescue.
- Streams are a mechanism for managing large collections on the client without keeping the resources on the server
notes:
MARK: If you haven't heard streams are a new mechanism for managing large collections on the client side without keeping the resources on the server. Streams has an elegant interface to insert and delete items from a client side collection.
- Chart is a client-side collection
- Avoid round-trips to the server
- Avoid redrawing the entire chart
notes:
MARK: In essence a chart is a client side collection as it manifests itself as a visualization. Pushing the chart coordinates into a stream allows us to insert new data points without having to roundtrip to the server or redraw the entire chart.


notes:
MEKS: Well given all these benefits for our use case this must be super hard to implement.
Mark: Actually in 3 simple steps we can take our existing functionality and get it working with streams. First, we add our chart line coordinates to a stream on our LiveView's mount. Second, we use stream_insert to add the latest_line into the stream. Third, we change our comprehension to iterate over the stream instead of socket assigns.

notes:
MARK: TADA we now have our chart updating with LiveView streams! In the image above you can see that we assign a unique ID to each line which is its datapoint and coordinates. You can see in the logs that only the new data point is shown. Streams is able to use these unique IDs to determine if it has drawn the line before or not. Thus we're updating our chart without going to the server or redrawing previous lines. Pretty neat!
- Bottom up approach
- Hand crafted an SVG to match design
- Abstracted chart elements piece by piece

notes:
MARK: Now that you've seen how we built SVG charts, you're probably wondering how we came up with this approach.
We started by building a Bar Chart with a bottom up approach. By bottom up I mean we had a given design to match and we hand crafted the markup for an SVG to match it.
Once we had the markup for a Bar Chart, we began to abstract the chart piece by piece. We started by dynamically drawing the background lines, then the labels, then finally the Bar Lines.
After all this abstracting was done we had a simple Bar Chart component that we could pass data into and it would draw a bar chart that visualized that data.
- Scaling the chart data

notes:
MEKS: So what didn't go well?
MARK: The first problem we ran into was when we starting plugging various datasets into the chart. We realized that we needed to scale the input data such that the data look correct relative to the dimensions of the chart. Here's a funny image of how we saw lines shoot right up off the top of the chart and through the bottom of the chart.
- Access to the coordinates

notes:
MARK: The second problem was in regards to click events and the positioning of the tooltip. When a user clicks on a line the coordinates of that line are pushed to the LiveView. When we went to the display the tooltip we could only place the tooltip relative to the line that was clicked. In this image you can see that the tooltip was placed right on top of the line that was clicked and obstructs other lines from view.
- Elements of the chart drawn independently

notes:
MARK: The third problem was that we drew each element of the chart independently. This was the simplest approach at the time but lead to some alignment issues where labels wouldn't line up with the data that they were supposed to represent. In this image you can see that the x labels do not align with the bar lines and the y labels do not align with the background lines.
- Start top-down with the data
- Developer access to coordinates
- Draw related elements together
notes:
MARK: What would we do differently? Well hindsight is 20-20 and if we did it again we'd make a few different decisions.
First we'd start with a top down, data driven approach and drive the implementation based on real input data. We believe this approach would lead to only building what you need to display the data and nothing more.
Second give the developer access to all the coordinates on events. With the Bar Chart the coordinates were generated then immediately used to draw the chart. The developer had no way to access the coordinates. If we had given the developer access to the coordinates then they'd have complete flexibility when reacting to chart events.
Finally we'd draw related elements together. We ended up with a few "magic" numbers to get everything to align perfectly but a lot of these issues are best addressed by drawing related elements together and utilizing SVG attributes in the right places.
- Learning SVG isn't too bad
- We didn't introduce a JS dependency
- Design dream makers
- Great power, great responsibility
notes:
MEKS: Overall would we recommend doing this? Well, it depends on your needs and use case. Learning SVG isn't too bad but you do need to understand the basics to be proficient. The hardest part for us was learning to think and visualize upside down.
MARK: We didn't have to add any new dependencies to our project to accomplish this feat and we now have complete freedom to improve and iterate on our chart building process.
MEKS: We can come really close to making all of our designer’s dreams come true. But building these components so that they are maintainable and easy for other devs to understand and use will be an ongoing effort.
Slides / example project: https://github.com/gridpoint-com/svg_island
 notes:
MARK: That's all folks. You can find these slides and the example project at the link above. And oh yeah, here's a photo of me on SVG Island. Thanks for attending.