ArcDiagrams
We need to load some CT files (or other supported formats) from the user's computer. The required procedure is illustrated in the screenshot below:
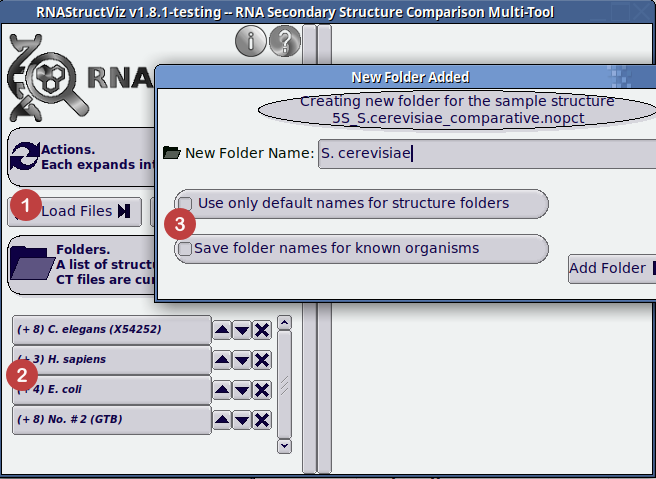
- Click to load structures from supported file formats.
- Loaded structures appear here in folders grouped by base sequence string.
- Time saver configuration options to speed up loading structures you have already named in previous sessions of RNAStructViz. Note that the dialog labeled in (3) will appear for users to name folders before the folders show up in (2).
To compare two structures in the same arc diagram, they must have the same underlying base sequence. RNAStructViz will automatically process the loaded input files and sort them into folders based on the underlying sequence data. We can select one of these folders by clicking the appropriate button on the lower-left of the image above. Once you have selected an organism by its folder, the right-hand side of the application is populated with the available CT structure file data. Note that, at any point, choosing a new folder by clicking on its button on the left-hand-side, will allow you to consider graphical visualizations of a new set of loaded structures. The menu of new options is shown below:
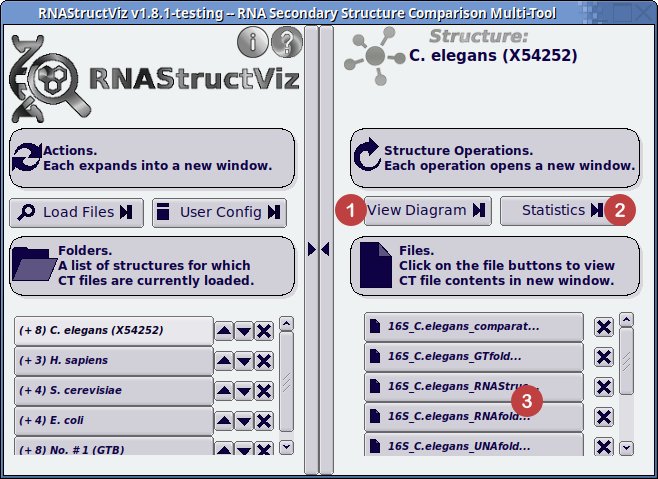
- Click button to view the Diagram Window.
- Click button to open the Statistics Window.
- Click on the particular structure in the selected folder to open the CT-formatted file viewer.
Once you have selected a folder on the left-hand-side window pane, click on the View Diagram button at the top of the right-hand of the window (1).
This will bring up the separate Diagram Window which is depicted in the image below:
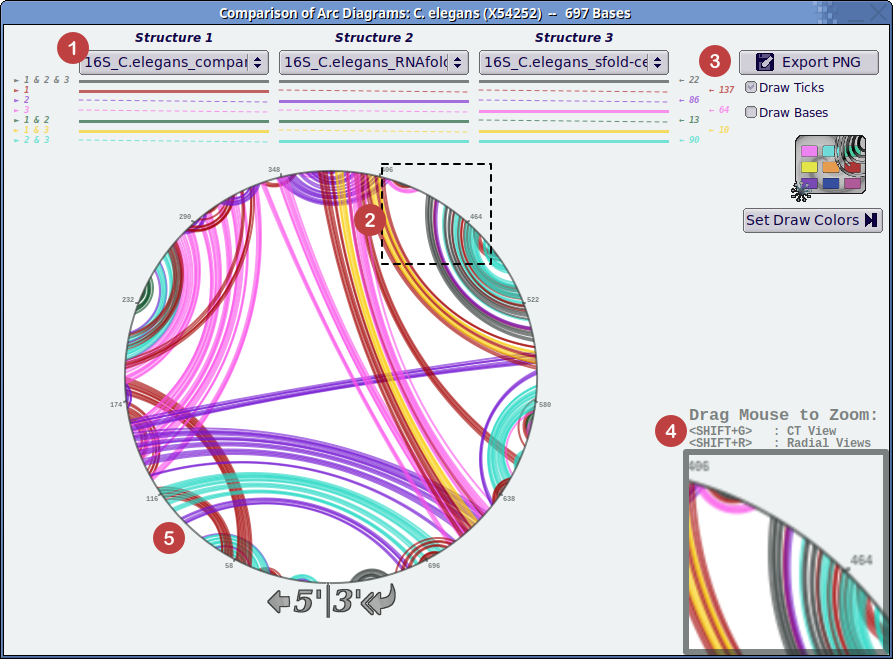
- Select up to three structure variants to compare overlayed at once from the drop down menus. The colored arrows (numbered with ampersand symbols) to the left and under the menus indicate inclusion in particular structures. The color-coded numbers to the right indicate the counts of these base pairings.
- Drag with the mouse button clicked to select a region of the structure around the circle (as shown by the dashed box).
- Export the generated arc diagram with additional metadata for accounting to PNG image format.
- Display of zoomed region on the arc diagram.
- Display of the color-coded arc diagrams.
There are several key features of the Diagram Window:
- The three drop-down menus at the top of the window allow you to select up to three structures to draw and compare.
- Different colors automatically are assigned to arcs belonging to each subset of the selected structures. These colors are displayed below the drop-down menus. (A solid line indicates that arcs of this color belong to the above structure; a dotted line shows that these arcs do not belong to the structure.) Color-coded integers to the right count arcs of each color. The colors used to highlight these arcs can be changed via user preferences.
- The Export PNG button at the upper right of the window allows you to save a copy of your current arc diagram for later reference or inclusion in papers or presentations.
- The zoom feature is activated by holding down the left mouse button and moving the mouse to enclose the rectangle you would like to magnify. The zoom feature resolution is discussed in our list of known limitations.
- Once you have zoomed in on a particular region of the structure, press <SHIFT+R> to open the radial layout viewer or <SHIFT+G> to open the integrated CT file viewer zoomed on the pairs contained in the selected region.