dsCompareCurves
dsCompareCurves assesses if multiple genomics signals (ChIP-seq, ATAC-seq, etc as .bigwig files) are significantly different or not for multiple region sets (.bed files), and specifically on which bins. dsCompareCurves uses two methods to do so: bootstraps and per-bin corrected Wilcoxon Rank-sum tests. The input for dsCompareCurves comes from deepTools computeMatrix --outFileNameMatrix, that thus must be used prior to dsCompareCurves.
In a nutshell, dsCompareCurves is replacing deepTools plotProfile, but with customisable, scalable and publication ready plots, in addition to providing statistical analyses.
dsCompareCurves compares regions for each signal (--comparison regions), or compares all signals for each region set (--comparison scores).
The plots are customizable in order to avoid using Inkscape or Illustrator: plot colors (although the basic color scale is color-blind friendly), fonts, plot size and size ratio (think 4:3 or 16:9).
| Command | Description |
|---|---|
--input -i |
DeepTools file obtained from computeMatrix --outFileNameMatrix. Alternatively, a .dscc file from previous dsCompareCurves runs can be provided for replotting purposes and to avoid the bootstraps computation once more |
--output -o |
Output prefix. Three files will be generated, a .pdf file containing the plot and a .dscc file containing the bootsraps information ( RDS file ). If a .dscc file is provided as input, only the plot will be produced as pdf |
--comparison -c |
When specifying 'regions' or 'scores', force a given comparison. The correct comparison to perform is otherwise automatically detected |
--scoreLabels |
Names of the scores to be displayed on the plots. It must be provided as text seperated by semi-colons, i.e. 'Score A;Score B;Score C' |
--regionLabels |
Names of the regions to be displayed on the plots. It must be provided as text seperated by semi-colons, i.e. 'Regions A;Regions B;Regions C' |
--signalName |
Name given to the signal, for instance 'H3K4me3 log2input'. Default: 'Genomic signal |
--bootstraps -b |
Number of bootstraps to perform. Default: 1000 |
--bootstrapsCI |
Confidence intervals (CI) threshold for bootstraps. Default: 0.95 |
--CPU -p |
Number of CPU to use. Default: 4 |
--wilcoxThreshold |
Threshold used to define significant bins on the Wilcoxon rank-sum test plot. Default: 0.05 |
--firstRegionName |
Name of the central or left region. Default: TSS |
--secondRegionName |
Name of the right region, only used when deeptools computeMatrix ran in scaled-regions mode. Default: TES |
--bootPlotShareY |
Given TRUE or FALSE, defines if the bootstraps plots should share the same scale on the y axis or not. Default: TRUE |
--bootPlotColors |
Change the bootstraps plot color palette to a user-provided one. The file must be tab-delimited and contain for each line two HTML color codes ( #3366CC #769EF2 ). The first column corresponds to the mean color, the second column corresponds to the color of the bootstrap confidence interval shadowed area. The default color scale contains 6 colors that are color blind friendly using the dichromat R package |
--bootPlotRatio |
Changes the aspect ratio of the plot. A value < 1 results in a wide plot, a value > 1 results in a narrow plot. Default: 0.85 |
--bootPlotWidth |
How large the bootstraps plot should be. Default: 5 |
--bootPlotHeight |
How tall the bootstraps plot should be. Default: 3 |
--wilcoxPlotWidth |
How large the Wilcoxon rank-sum test plot should be. Default: 4 |
--wilcoxPlotHeight |
How tall the Wilcoxon rank-sum test plot should be. Default: 4 |
--font |
Font used for plotting, given a TTF file. Default is usually Helvetica |
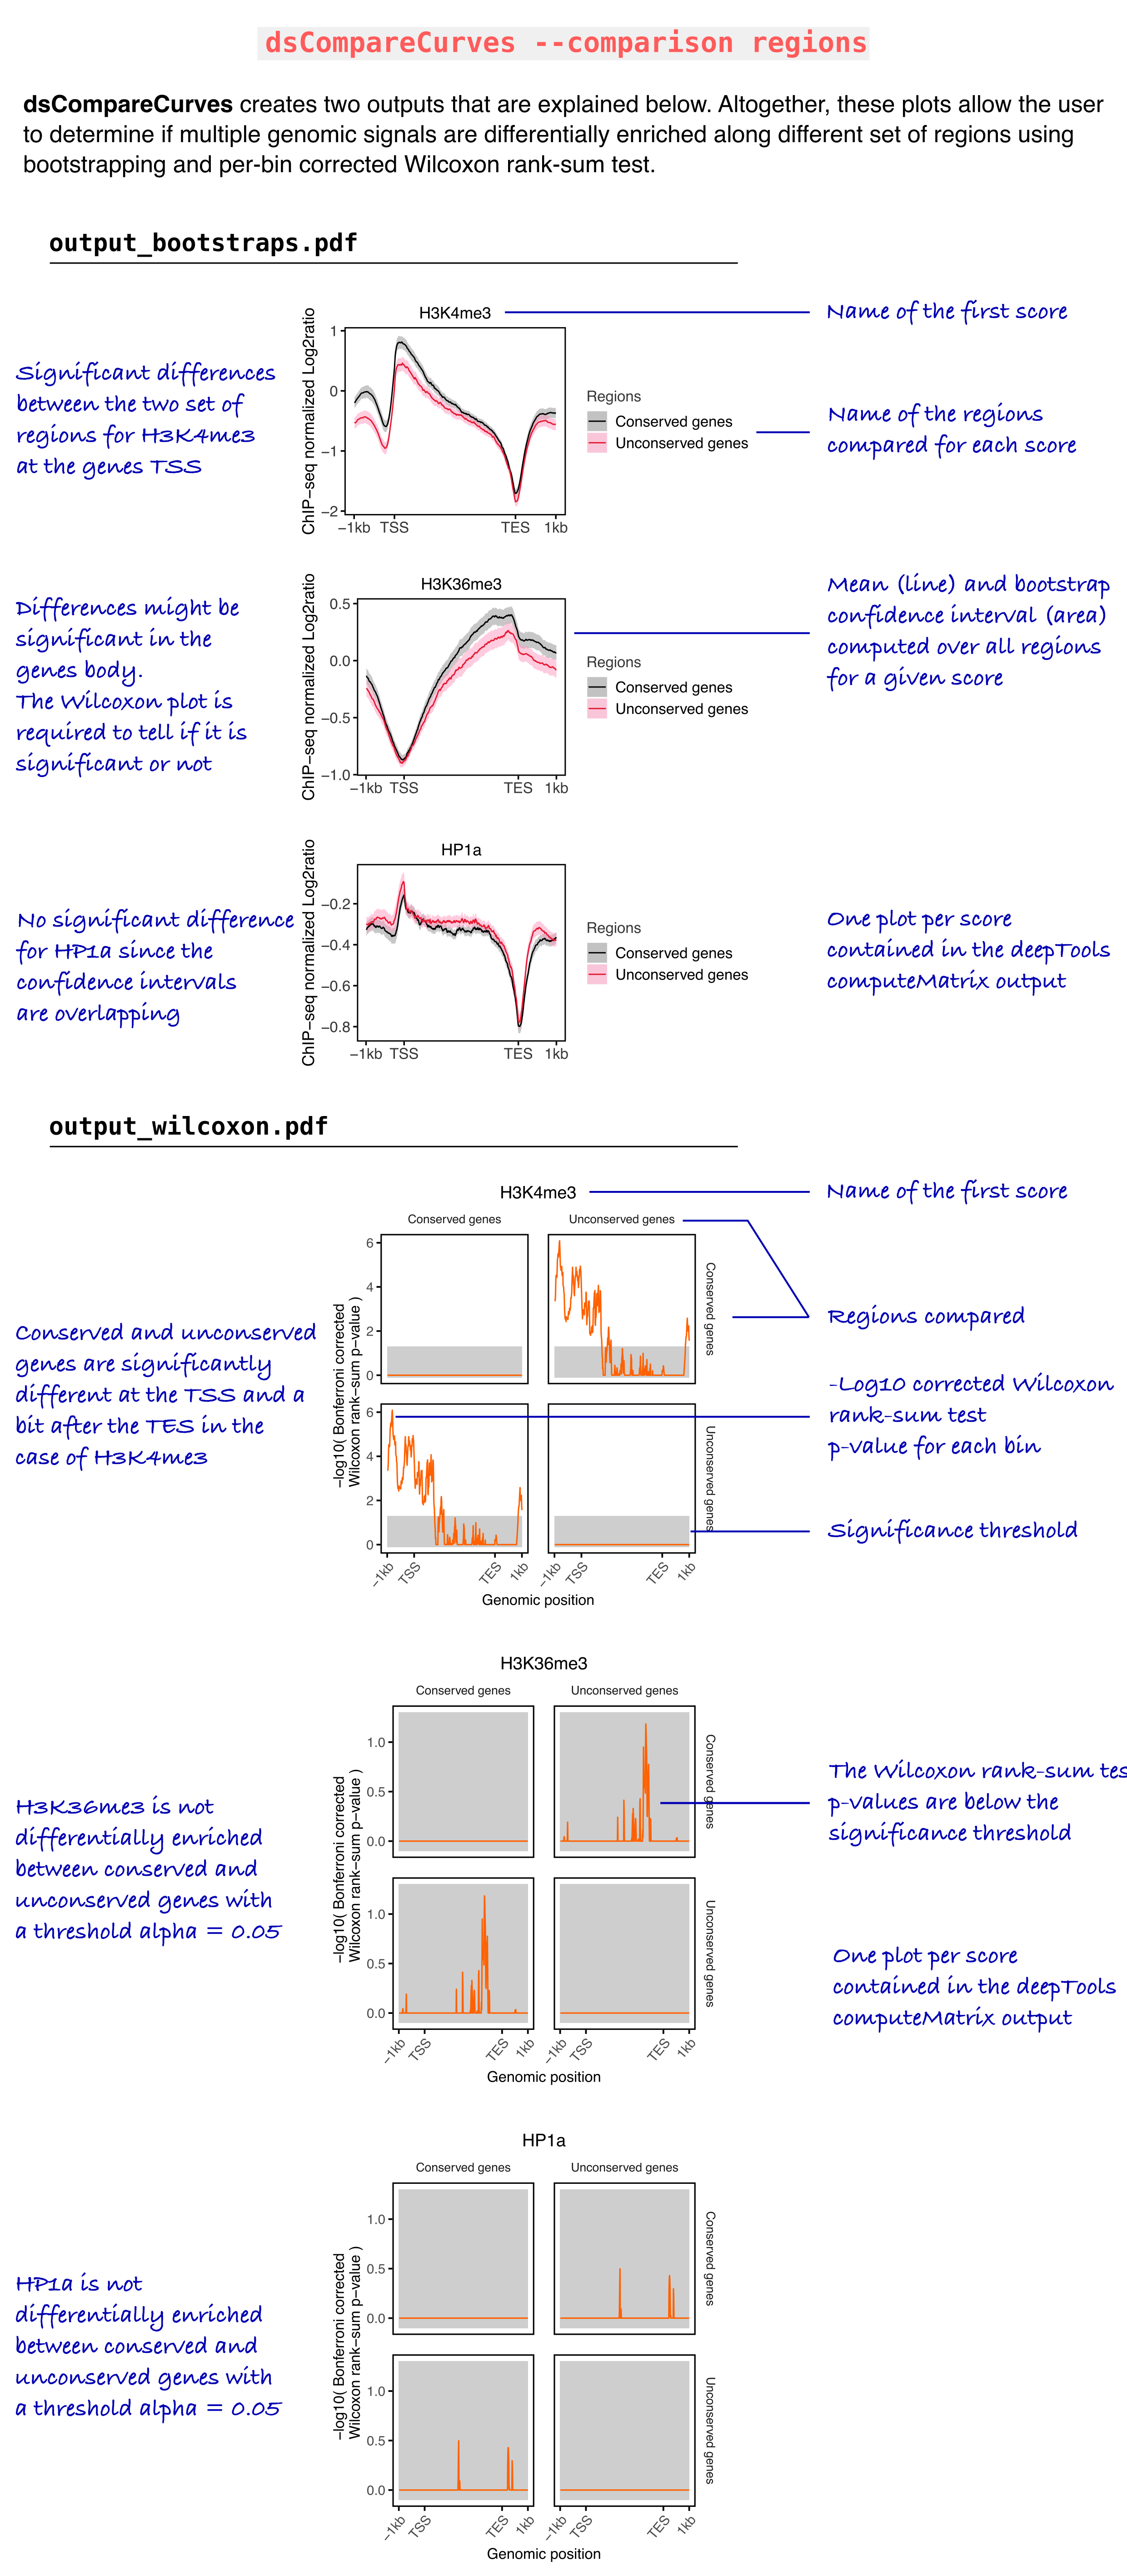
Below you can find an example of regions comparison.
We consider two set of regions, conserved genes, and unconserved genes in Drosophila melanogaster. We want to know which histone marks from modENCODE are differentially enriched between these two regions sets.
Prior to dsCompareCurves, we used deepTools computeMatrix scale-regions with the two bed files as regions, and the three histone marks bigwig tracks as scores. We also added the optional parameter outFileNameMatrix in order to get the output as a tab-delimited file (.txt).
computeMatrix scaled-regions -R conserved_genes.bed unconserved_genes.bed \
-S H3K4me3_modENCORE.bw H3K36me3_modENCORE.bw HP1a_modENCODE.bw \
-a 1000 -b 1000 -m 3000 -o deeptools_computeMatrix_output.npz \
--outFileNameMatrix deeptools_computeMatrix_output.txt
For more information about deepTools computeMatrix: https://deeptools.readthedocs.io/en/develop/content/tools/computeMatrix.html
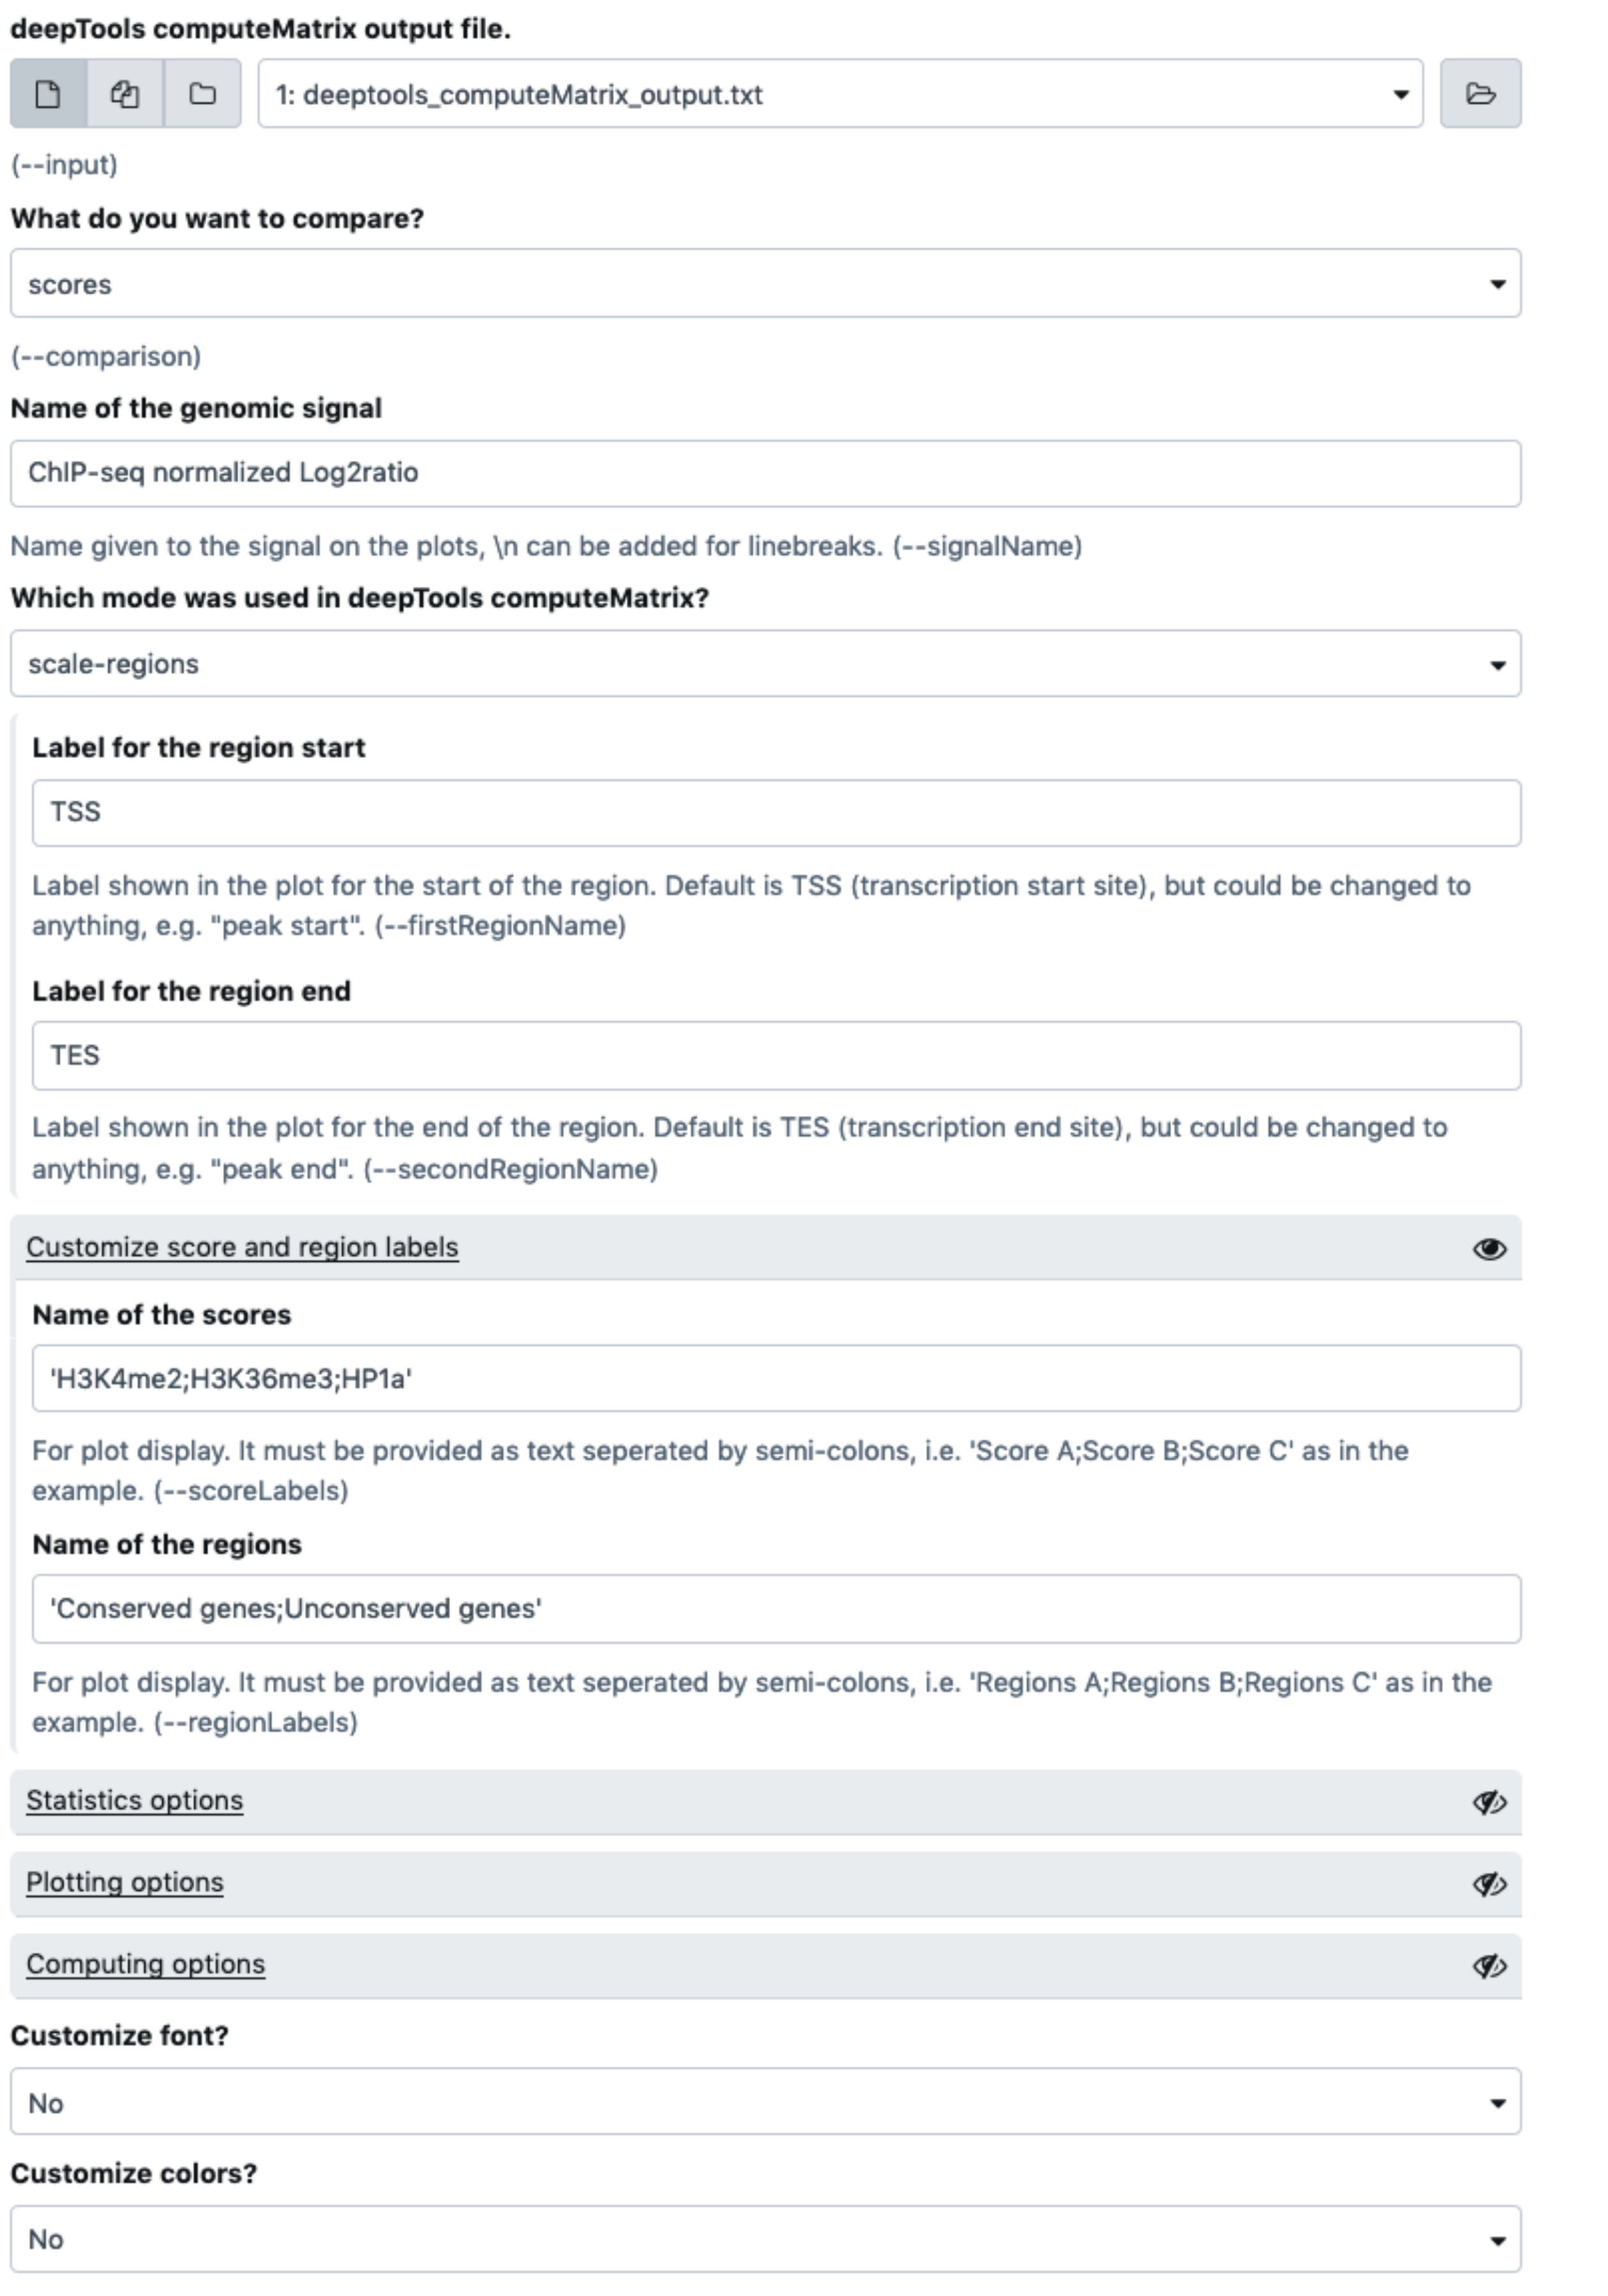
The latter file deeptools_computeMatrix_output.txt is then used as input for the present tool in "regions" mode, in order to compare the conserved and unconserved genes for each one of the three histone marks scores.
dsCompareCurves -i deeptools_computeMatrix_output.txt -o output \
--signalName "ChIP-seq normalized Log2ratio" \
--scoreLabel "H3K4me3;H3K36me3;HP1a" \
--regionLabel "Conserved genes;Unconserved genes" \
--comparison regions -b 1000 -p 20
You can find an image describing the outputs below using the said data set and the parameters used for the same analysis on Galaxy: