What is it:
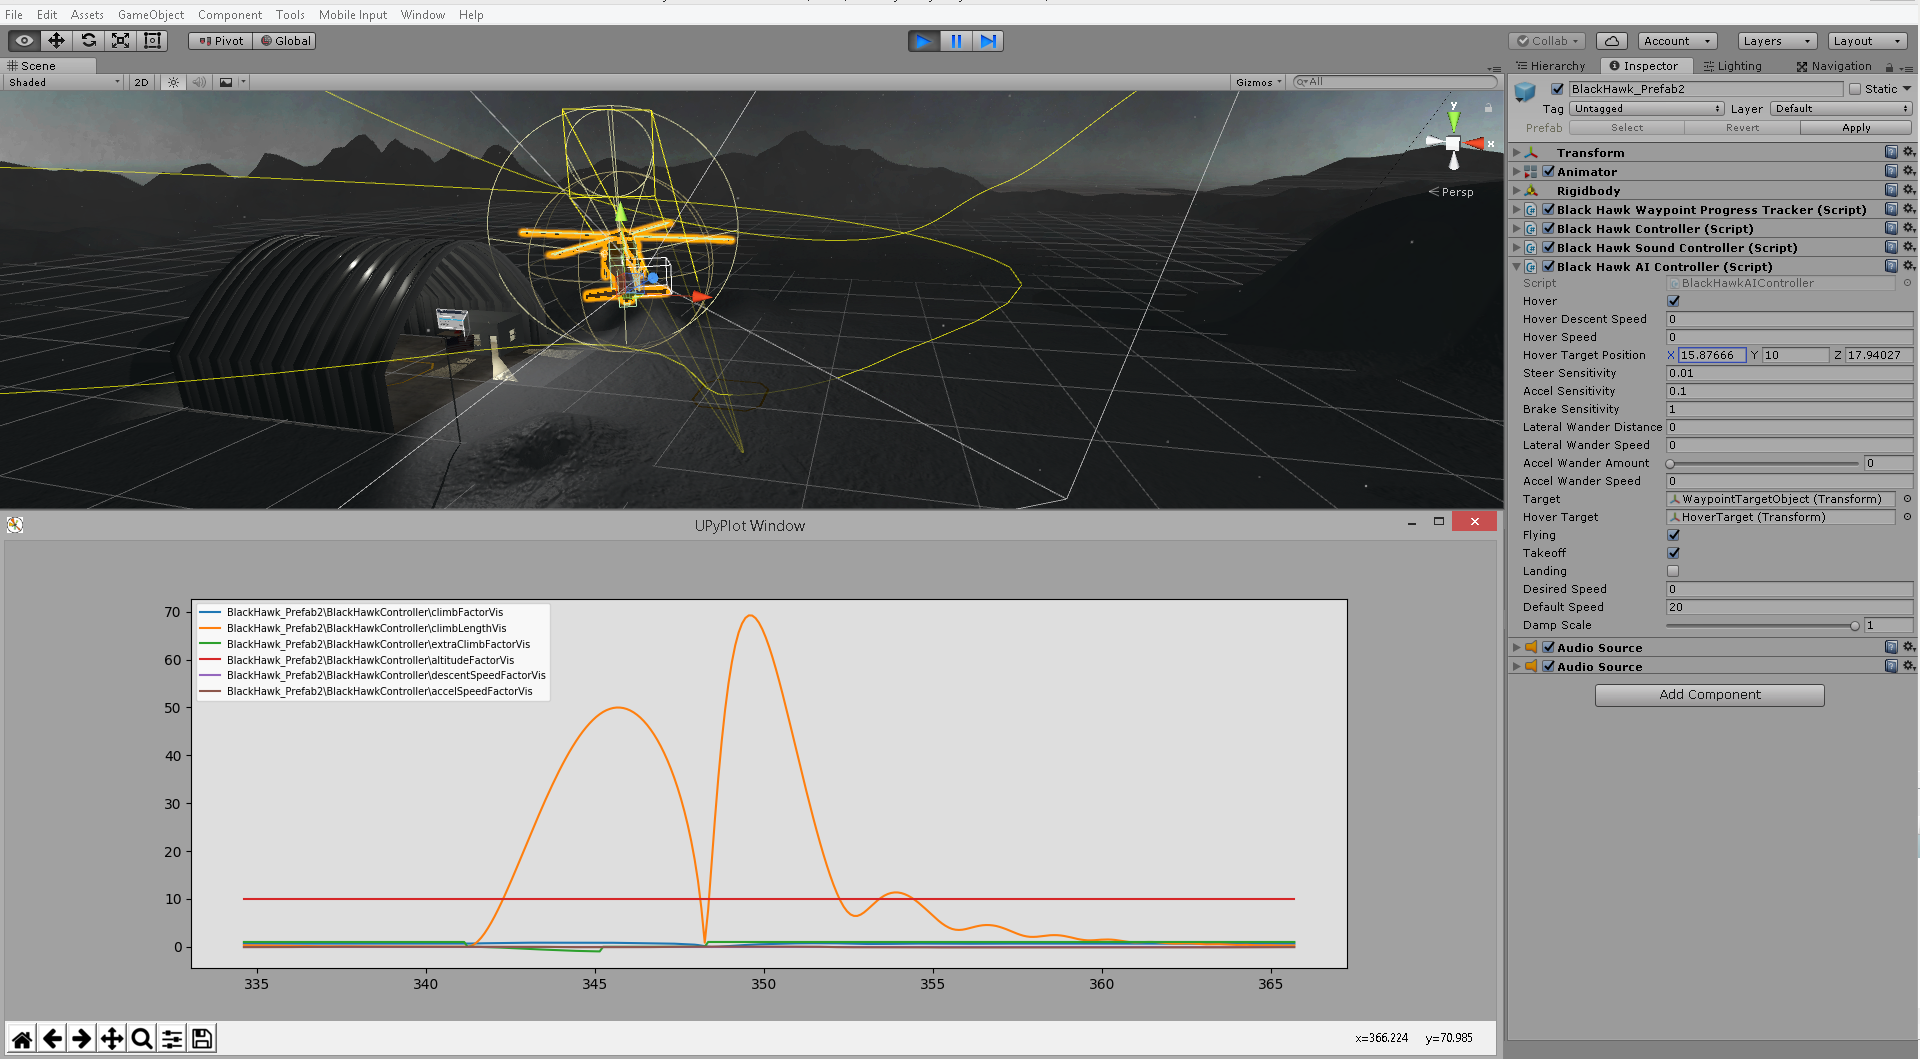
The intention of this example was to build an easy to use plotting tool for visualizing the values generated by AI controllers and to see how their PID loops were affecting vehicles causing them to overshoot/undershoot or act undesirably.
This tool was designed to help diagnose multiple variables from multiple scripts simultaneously, with rapid implementation and minimal user code modification.
Prerequisites:
- Example was created using Unity 2017, but earlier versions should support the feature set.
- Python 2.7 with MatPlotLib and NumPy installed.
- All examples were tested on C# scripts only, no guarentees for javascript.
How to use:
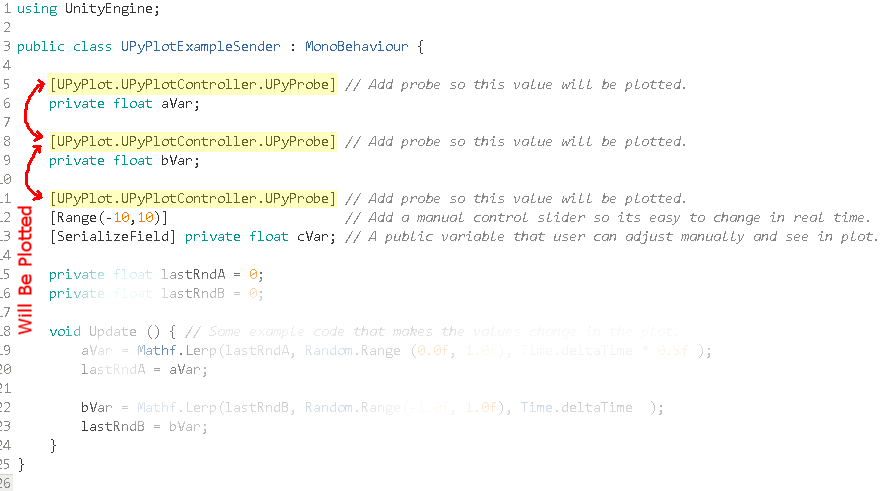
It's pretty straight forward to add a probe attribute and plot any private or public variable. A probe attribute simply works as a flag that tells the UPyPlotController to store a reference to it when it scans all objects for probes during start time. Any varialbe with that attribute will then be polled at the specified interval durring runtime.
To add a probe attribute, do so as you would any other attribute, where in this case you add a [UPyPlot.UPyPlotController.UPyProbe] custom attribute above the desired variable decloration. And that is all that is required in order to plot a variables in a script.
Integrating with your own project:
- Copy the UPyPlot folder and all of it's contents from this example's assets folder to your projects assets folder.
- Place the UPyPlotController prefab into your scene.
- Ensure the output filename matches what is set in PlotViewer.py (default is plot.txt).
- Add the [UPyPlot.UPyPlotController.UPyProbe] attribute to any variable you want shown in the plot.
- Run the PlotViewer.py Python file and start your scene (in any order).
- Enjoy.
Configuration:
At present this tool offers some configurability such as:
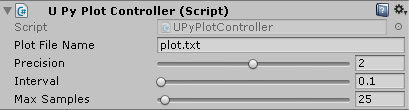
- Precision - Number of decimal places for each value in the plot data file.
- Interval - Rate in seconds which to update plot data file with new values.
- Max Samples - Maximum lines/history that the plot file should contain.
Advanced Viewer (UPyPlotAdvancedViewer.py):
I have also added a second Python script for an "advanced" viewer (similar to the basic viewer) and has an additional button for changing the plot style. This allows selecting between a single plot style where all lines are combined on a single axes and scale, and another style where each line has it's own individual plot axes:
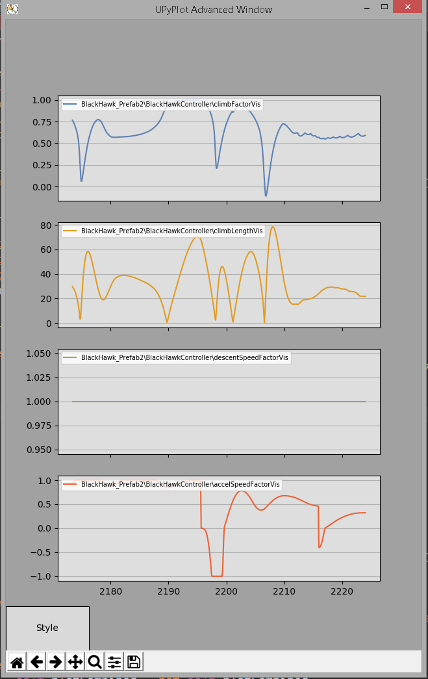
Note that the individual mode appears to update at a slightly reduced rate when compared to the combined mode. I may address this in a future update.
Please feel free to use this example in any way you see fit (without restriction of any kind) as well as redistribute, modify and share it with all of your friends and co-workers.
Legal notice: By downloading or using any resource from this example you agree that I (the author) am not liable for any losses or damages due to the use of any part(s) of the content in this example. It is distributed as is and without any warranty or guarantees.
Project by: Grant Olsen (jython.scripts@gmail.com) Creation year: 2017