06 The LogicAnalyzer program

This is the main software, the LogicAnalyzer way to use the device.
Let's take a look to the main window of the software and its sections.
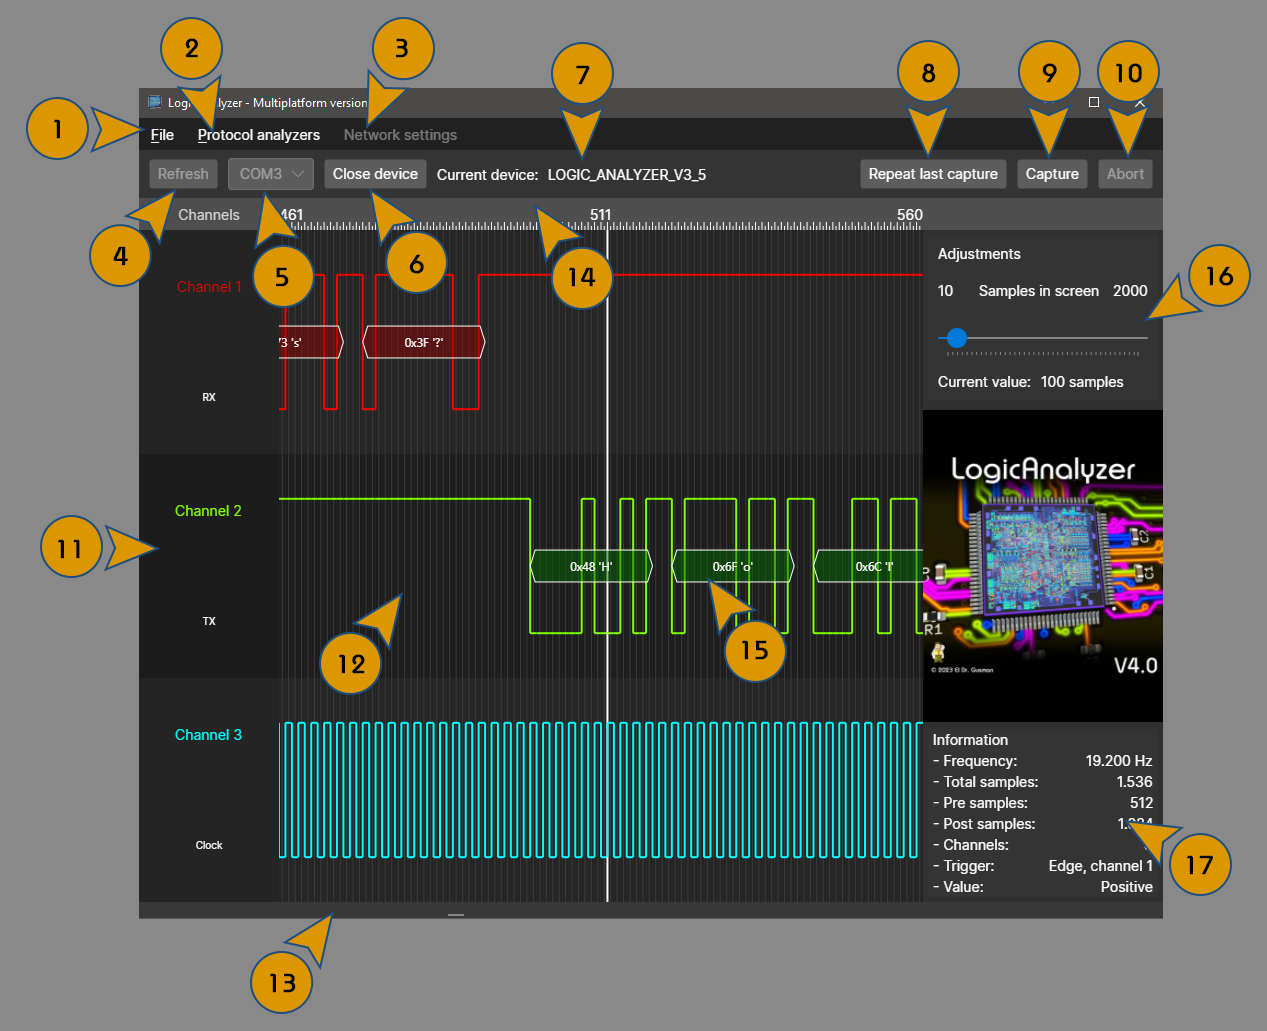
- 1: File menu, allows to manage capture files.
- 2: Protocol analyzers menu, allows to invoke installed protocol analyzers.
- 3: Network settings, allows to configure a WiFi device network settings.
- 4: Refresh button, refreshes the list of available COM ports.
- 5: Port selector, selects the device to connect to.
- 6: Open/Close device button, connects or disconnects to a device.
- 7: Device identification, shows which device type is connected to the software.
- 8: Repeat capture button, repeats the last capture with the same parameters.
- 9: Capture button, opens the capture dialog.
- 10: Abort button, cancels a running capture.
- 11: Channel viewer, shows the info of the captured channels.
- 12: Sample viewer, shows the captured samples.
- 13: Sample viewer position, slides the sample viewer.
- 14: Sample marker, shows which samples are displayed and is used to perform operations over the samples.
- 15: Analyzed protocol data, this is how data of a protocol analyzer is shown.
- 16: Sample viewer selector, selects how many samples are displayed in screen.
- 17: Capture info, shows information about how the current capture was realized.
Everything is mostly straight forward, the most basic usage would be to connect to a device, press over "capture", configure the capture dialog and accept it, the device will start the capture and once the capture finishes the samples will be displayed in the sample viewer. But of course, this is the most basic usage, the software allows to do a lot more things so we're going to explore it section by section.
Now we're going to take a look to all the menus of the application to see to which functionalities we can access and then we will see how to use all the functions of the device.

The file menu allows to manage capture files. LogicAnalyzer allows you to store captures with all the information about the capture, this is very useful to share or compare captures, and for managing these files we use the "File" menu.
The file menu has these options:
- 1: New..., creates a new capture file. It is created using the "Signal Description Language" (from now on SDL), more info on the Creating samples section.
- 2: Open..., opens an existing capture file.
- 3: Save..., saves the current capture, storing all the info about it and the created regions (more info on the Regions section).
- 4: Export..., exports the current capture to a CSV file compatible with other programs like PulseView.
- 5: Exit, closes the application.

The protocol analyzers menu allows to invoke a protocol analyzer or clear the overlayed information from the sample viewer. Keep in mind that this menu is dynamic, it will show the analyzers that are installed in the "analyzers" folder, you can create your own analyzers (more info on the Creating custom analyzers section) and they will be shown here. Also, this menu may change its order as it's populated based on the order that the files are found. For now lets see the ones preinstalled as default.
- 1: I2C, allows analyze the I2C protocol.
- 2: SPI, allows to analyze the SPI protocol.
- 3: Serial: allows to analyze the RS-232 protocol
- 4: Clear analysis data: clears any data that has been overlayed over the sample viewer by the protocol analyzers.

This menu has a single option, "Update network settings" and will be only enabled if the software is connected to a Pico-W analyzer through USB. As its name implies it updates the network settings of the device.
The connection to a single device through USB is straightforward, just select the device from the drop down and press "Open", that's it.
But there are two other device types, the "Network" device and the "Multidevice" device.
This is used to connect to the Pico-W through WiFi. Once we select it and press "Open", this will present us with the network settings dialog.

This dialog is very simple, we introduce the IP address of the device (we must have configured it prior using the Network settings menu), the port and we press "Accept", if the device is available it will get connected.
This is used to connect to up to five devices that are connected in daisy chain, the first one will act as master and will be the one responsible of detecting the trigger condition (only complex and fast triggers allowed, more info on the Capture section), the other four will act as slaves and will capture once the master has detected the trigger.

First we must select the master device, and then enable as many devices as we have connected in daisy-chain and configure their settings. If we choose a Network device we will be presented with the network settings dialog and the introduced settings will be displayed next to the drop-down menu of the device.
Once we have all the devices set-up we can press on "Accept" and if everything works ok we will see the device comming up as "MULTI_ANALYZER_(version)". Beware that all the devices must share the same device version, if you have different versions programmed in the devices the driver will refuse to connect to them as a multidevice chain.

Now that we are familiar with the connection process let's go to the real deal, capturing.
Once we press the "Capture" button we will be presented with the Capture dialog.

On the first row of the dialog we will see the basic parameters of the capture: frequency (samples per second), pre-trigger samples and post-trigger samples.
The frequency selector allows to choose the ammount of samples per second that we will capture, this can range from 3100 (3.1Khz) to 100000000 (100Mhz).
Next we have the ammount of samples that will be stored before the trigger happens, this is really useful to verify the state of the channels before our trigger condition has been met.
Finally we have the ammount of samples that will be stored after the trigger happens, that will be our main captured data.
The quantity of samples that we can capture will depend on how many and which channels we capture. These limits are:
- Up to channel 8 (Mode 0)
- Minimum of 2 pre-trigger samples
- Maximum of 98303 pre-trigger samples
- Minimum of 512 post-trigger samples
- Maximum of 131069 post-trigger samples
- Up to channel 16 (Mode 1)
- Minimum of 2 pre-trigger samples
- Maximum of 49151 pre-trigger samples
- Minimum of 512 post-trigger samples
- Maximum of 65533 post-trigger samples
- Up to channel 24 (Mode 2)
- Minimum of 2 pre-trigger samples
- Maximum of 24576 pre-trigger samples
- Minimum of 512 post-trigger samples
- Maximum of 32765 post-trigger samples
This rule applies to the Multidevice the same but taking into account the device that uses the highest channel, so for example, if we have two devices we have 48 available channels, channels 1 to 24 are the first device channels, channels 25 to 48 are the second device channels that range from 1 to 24. Per example, if we choose channel 1 and channel 48 we are using channel 1 of the first device and channel 24 of the second device, so the choosen capture mode will be mode 2.
Next we have the channel selector, this allows us to choose which channels we want to capture. You can choose randomly which channels to use, but bear in mind the rules applied by the mode selection. Besides enabling the channel for the capture we can also name the channel, this will be shown in the channel viewer after the channel number and also will be stored in any capture file that is saved (this is really useful to remember which signal is which if we store the capture for a later analysis).
Finally we have the trigger selector. It is divided in two differentiated sections, the Edge trigger section and the Pattern trigger section.
The edge trigger is the most simple but fastest of all, it will trigger when a channel takes a high or low value. If we select the "Edge" radio button we will be able to select one of the 24 channels which will be the trigger channel, and also we can choose if the edge is positive or negative (high or low). Beware that this trigger mode will not be available if we are using a multidevice, this can only work with pattern triggers.
Also, we have the burst mode activation. In this mode the device will capture n bursts of data once the trigger condition is detected, once the specified data ammount for post-trigger samples is captured the trigger detector is automatically rearmed and the device will start a capture again once the trigger condition is met and will repeat this operation n-1 times, this allows to do an efficient usage of the sample memory discarding unwanted data. The trigger rearming takes approximatelly 2 cycles of capture data, so if you use a safe sampling frecuency you can use small bursts and not to lose any valuable information while discarding all unnecessary "blank" samples. For example, if you are going to capture data from a SPI port running at 1Mhz you can configure the trigger to use the CS line, do bursts of 50 samples and capture at a frequency of 5Mhz, this will give 5 samples per transferred bit and if the port is transferring when the burst is finished the trigger will be rearmed immediatelly and you still will capture the bit correctly.
The pattern trigger is a lot more complex, instead of a single channel we can use up to 16 channels and it will be met when all the specified channels form a concrete pattern, but this is also slower than the edge trigger and has some restrictions. First, we must specify the base channel, this is the first channel used for the pattern. It can range from channel 1 to channel 16 and the pattern cannot exceed channel 16, so if we use channel 8 as the base channel we have 9 channels available for the pattern, if we choose channel 2 we have 15 channels available for the pattern, etc.
Also we can specify a "fast" mode, this mode is more restrictive but is also more precise, the pattern will only allow up to five channels but the trigger will run at 100Mhz. If we do not select the fast mode the trigger will run approximately at 66Mhz, so keep that in mind. This should not be a problem unless the trigger condition lasts less than a period, as we can choose how many samples we will capture before and affter the trigger we can set up it in a way that we are safe having for sure that we don't miss any important data. This is also compensated by the driver itself, so usually no matter which one we choose it will have approximatelly an error of +-1 sample.
The pattern trigger has these limitations because it uses a secondary PIO unit of the pico to check the trigger pattern wile the edge trigger uses the same program for capturing and detecting the trigger. This is why also we must tie together GPIO0 and GPIO1, the trigger program notifies the capture program of the trigger condition rising GPIO0 and the capture program reads it using GPIO1.
Once we have set all the parameters we are ready to start the capture. Press on "Accept" and the capture dialog will be closed, the device will start blinking and it will wait for the trigger condition to be met. If for some reason we want to cancel the capture the "Abort" button will be enabled and will stop the capture.
Once the capture finishes the samples will be presented on screen and the sample viewer will jump to a where the trigger happened and will adjust how many samples are shown in screen.
As each device of the chain runs its own clock there may be a little deviation between them, this deviation can be of +-1 sample, so take it into account. You can always fix this deviation after the capture has been done ushing the Shift functionality to align them properly.
Once you have captured data or opened a stored capture the samples will be presented in the main screen.

To simplify navigation in the capture viewer, once you place the cursor over the scroll bar a reduced representation of the full capture will pop-up so you will be able to see the full data and a marker representing the start of the visible data.
Also, you can use some shortcuts to move the captured data:
- Ctrl+Left: move samples to the right a 10% of the visible samples
- Ctrl+Right: move samples to the left a 10% of the visible samples
- Ctrl+Down: move samples to the right a 100% of the visible samples (a full page)
- Ctrl+Up: move samples to the left a 100% of the visible samples (a full page)
- Shift+Left: move samples one sample to the right
- Shift+Right: move samples one sample to the left
As we have seen the program includes by default three protocol analyzers: I2C, SPI and Serial. Once we have a capture loaded we can run as many of these as we need, we can run the same analyzer or multiple different ones sobre a capture and the info will be merged, this allows to capture per example three SPI devices at once and analyze them on the same capture, or analyze an SPI device and a Serial one, etc.
If we select the I2C analyzer we will be presented with the configuration dialog.

To use the analyzer you need to specify which channel is the SDC channel and the SDA channel (clock and data). The dialog looks a bit weird, but that has a reason, all the protocol analyzers are implemented using a common interface, if you want to know how they are implemented check the section Creating custom analyzers.
Once we have selected both channels the analyzer will run and will show us the information about the capture.

The analyzer will show the start and stop conditions, the operation requests, addresses and will include in each byte if it was acknoledged or not and if a frame error happened. The conditions will be shown between "<" and ">", "A" means "Acknowledged", "N" means "Not acknowledged" and "F" means "Frame error".
Choosing the SPI analyzer will bring the SPI analyzer dialog.

Note how this dialog now fits better, and notice that a scrollbar has appeared on the right side, that's because all the settings don't fit in the dialog.
To configure the analyzer we must provide: CS, CK, MISO and MOSI channels, shift direction (LSB to MSB or MSB to LSB) CPOL (polarity) and CPHA (sampling edge). CS, MISO and MOSI channels are optional, if no CS channel is specified the analyzer assumes that the device is always selected, and same for MISO and MOSI, if one of them is not provided it will not be processed (at least one of the IO channels must be selected). The CK channel is mandatory.
Once we have selected the parameters the analyzer will show us the data about the capture.

The SPI protocol is in fact the simplest (but safest) of the implemented protocols, it is totally synchronous and it has different lines for the master and slave data, so it provides only information about the data that has been read.
Choosing the Serial analyzer will bring the Serial analyzer dialog.

To configure the analyzer we must provide: The RX and TX channels, polarity (real RS-232 physical layer uses a negative polarity but nowadays is more common to find TTL physical layers which use positive polarity), the data bits, parity, stop bits and bauds. RX and TX are optional but at least one must be provided, and all the rest of the parameters are required.
Before continuing, I must remark that you will get frame errors unless the capture is not correctly done. RS-232 is asynchronous so there is no clock signal, because that the analyzer will try to compute the clock based on the sampling frequency and the specified bauds, but if you don't capture a multiple of the transmission bauds it is very possible that framing errors will be detected as it will read some bits that are out of the frame position.
Once we have entered all the parameters the analyzed data will be shown.

The analyzer will show the analyzed data and if it finds any frame error it will also be shown in the packet as "F".
Sometimes it will be useful to edit captures, to get rid of useless samples, insert missing data, duplicate samples, etc. For this we will use the context dialog from the sample marker.

First we have the Insert option, this will allow to insert a number of samples in the place that we have clicked. This will bring the create samples dialog, this allows to create samples using the SDL language (more in the Creating samples section).

Next we have the regular edit options: cut, copy, paste and delete. To use the cut, copy and delete functions first we must select a range in the sample marker, you can left click on the sample marker and drag, or you can place the temporary marker (left click the sample marker), go to where you want to end the selection and use Ctrl+left click to create a range (you can drag also once you clicked wit Ctrl+left click). To paste a set of samples you must first have cutted or copied a range of samples.
The next edit operation is Shift, this will shift some channels an ammount of samples.

The shifting will happen at the sample where we clicked to bring up the context menu and we can shift as many channels as we want. To select/deselect a channel from the list you can click on it or you can Ctrl+click and drag to invert the selection status of many channels at once.
We can also choose to shift to the left or to the right, and what will be inserted in the shifted samples: a low value, a high value or rotate the samples.
This is not an edit feature but it is included in the same menu as it needs a range of samples to be selected. If we choose the "Measure" option the Measure dialog will pop with useful information like number of samples selected, duration of the samples, frequency and so on.

Finally we have the regions functionality. Sometimes it will be useful to highlight a region of the samples, maybe you want to share the capture with someone and show which area is important, or maybe you want to save the file for later usage and want to indicate some regions that are important on the capture.
For this we can create a region, for that we first need to select a range of samples, bring the context menu and then choose "Create region". This will bring the region dialog.

To create a region we can give to it a name and choose a color. Once we have selected the parameters the region will be shown in the sample viewer.

If we want to get rid of a region right click on the sample marker over the region area and the "Delete region" menu will be enabled, click on it and it will be deleted.
Regions will be adjusted if we edit the samples, if we delete samples that belong to a region the region will be shortened, if we insert the region will be expanded and if all the samples of the region are deleted the region will be also deleted.
LogicAnalyzer incorporates a powerful way to create samples, the SDL language. This allows to patch and create capture files from scratch in an easy way. The program incorporates even a syntax coloring editor for the SDL language what makes very easy to create these files.
But, why? Why is so important to create these samples? Well, it is really related to a new functionality that will be added in the future, the possibility to replay a capture file.
We already have seen the Create samples dialog in the basic editing section but there has been no explanation on how it works, so lets see it in action.

Here we have three differentiated sections:
- Ammount selector, specifies how many samples we're going to create, only available in the "Insert" mode.
- Channel information, here we can see the channel number and name
- Signal viewer, this is a representation of the signal that has been generated
To generate a signal we click over the signal viewer of a channel and that will bring the signal compositor, if we already have loaded or created an SDL for the channel it will be automatically loaded.
Let's see the signal compositor with a file loaded.

As we can see the editor colors the syntax so it is easy to spot errors in the SDL. It also allows to save and load SDL files, and can validate if our SDL is well formed. If we validate the file and it is ok it will tell us how many samples will be generated, if it finds an error it will tell us which code has caused it.
Once the SDL is created we can close the signal compositor and the signal view of the channel will be updated with the new signal. If our SDL generates less samples than the specified ones the last sample will be repeated to fill the empty samples.
This is the language that I have created to describe a digital signal. Keep in mind that this is the first version of the language and in the future I may add more functionalities, but for now it makes very easy to create a signal.
The language recognizes six types of objects: directives, primitives, anonymous groups, named groups, group names and complex objects. Each object must be finished by a semicolon except for the last object in the file (this may change in the future, so I recommend to finish ALL the objects with the semicolon).
The SDL also recognizes strings, numbers and comments, numbers can be written in decimal (1234...) or hexadecimal (0x12..) and comments can be inline (//blablabla...) or blocks (/* blablabla */). Comment blocks can also be multiline.
Strings are written between quotes and accept escaped characters like C, (\r, \n, \t...). There are also two special chars that need to be escaped and are the semicolon and the comma, this is because it makes a lot easier to parse the language and it's a very small tradeoff for making the parser tons of times simpler 😄
For now there is only a single directive, the "Initial status" directive. This directive indicates which state we assume the line is for the first sample, this is useful when we use the "invert" or "equal" primitives. The initial status directive is represented by the dollar sign followed by a one or a zero indicating the line status.
$1; //Assume line high
$0; //assume line low
Primitives are the most basic of the objects that we can use and describe a line status followed by a number of samples. The available primitives are:
- "h", means "high line", it will generate n samples with a high value.
- "l", means "low line", it will generate n samples with a low value.
- "!", means "invert line", it will generate n samples with the inverse value of the previous sample generated before the primitive.
- "=", means "keep line", it will generate n samples with the same value as the previous sample generated before the primitive.
For example, if we want to represent four clock cycles of 5 samples per pulse we could write:
h5; l5; h5; l5; h5; l5; h5; l5;
The invert and equal are very useful to describe signals that represent for example a NRZ protocol, a differential manchester or similar. Lets imagine that we want to send three bits (101) encoded as NRZ with a clock period of three samples. We could write:
$0; //Assume line low
!3; //Invert line, a "one" bit
=3; //Keep line with the same satus, a "zero" bit
!3; //Invert line, a "one" bit
We would be able to write anything with primitives but it would be a really painful task to write each line transition. To simplify this task SDL implements what are known as "Groups".
First we will see the anonymous groups. An anonymous group is composed of a list of objects (excluding anonymous groups) and a number of repetitions. It will be executed where it is found on the file.
An anonymous group is written in the form of:
{(list of objects)}(repetitions);
The list of objects must be sepparated by a comma and cannot contain other anonymous groups.
Lets see an example. Let's suppose our first example where we have created a clock signal, and now we want to extend it to instead of four cycles to be 1000 cycles long. We can write it like this:
{h5, l5}1000;
A lot shorter and easier to read, right? As you can see the anonymous groups are powerful, but as they are executed in place and cannot be reused they become a bit limited for complex signals.
For this SDL implements named groups. A named group is a group definition with a given name that can be invoked as many times as we need using a group name object. The group will not be executed where it is found, instead its definition will be kept in memory and will be invoked each time it is referenced by a group name.
A named group is written in the form of:
{<(name)>,(list of objects)}(repetitions);
The syntax is the same as for the anonymous groups but it contains at the beginning the name of the group. For example, lets suppose that we have a protocol that has a stop condition for each frame of data that is four pulses that invert the line value. We could write it like this:
{<stop>, !1}4;
Now, we can invoke this group using the group name object. The group name object is written in the form of:
[(group name)]
So, to invoke the previous group we could do:
h1;l1;h1;h1;l1;h1;l1;l1;[stop];
This will send eight data pulses and finally the stop condition, our four inverting pulses.
As you can see now the groups become really powerful simplifying the task of describing a signal a lot. But still, this can be a bit painful to create complex signals that are composed of binary data.
To describe really complex signals (for example serial transmissions) it could be a pain to create these manually, even using groups, so SDL exposes two complex objects with two variants.
First, before using any complex object we must define two special named groups, the group "0" and the group "1". These two groups will describe which levels will represent a one or a zero in a binary transference. For example, let's implement the zero and one bits for a manchester differential protocol. This protocol has a clock and a transition per bit in the same line, so each bit really lasts two cycles, one where a transition of the line must happen always (the clock) and one that may or may not have a transition (a one or a zero). Said this, we can describe these bits like these:
{<0>,!1,=1}1; //Invert the line and keep it at that value one cycle, we could also write it like "!2" but we use the "=" object for clarity.
{<1>,!1,!1}1; //Invert the line for the clock sample and invert it again for the data sample.
Ok, now, what are good for these groups? Well, they will be used by the complex types to describe binary data. These objects are:
- byte, represents eight bits
- "b", this is a byte encoded LSB to MSB
- "B", this is a byte encoded MSB to LSB
- string, represents an ASCII string
- "s", this is a string encoded LSB to MSB
- "S", this is a string encoded MSB to LSB
Ok! So, this looks more interesting, right? Now creating a complex signal with binary data becomes a lot easier!
Let's go with a protocol (well a pseudo-implementation of it) that I have found latelly, this is the protocol used by the Sincalir microdives, it begins with a preamble of the zero bytes, two 0xFF bytes and after that it contains the data, and it is encoded as manchester differential. We could describe this signal like this:
{<0>,!1,=1}1; //Invert the line and keep it at that value one cycle, we could also write it like "!2" but we use the "=" object for clarity.
{<1>,!1,!1}1; //Invert the line for the clock sample and invert it again for the data sample.
{<pzero>,b0x00}10; //Ten zeros for the preamble
{<pff>,b0xff}2; //Two 255's for the preamble
{<preamble>,[pzero],[pff]}1; //The composite preamble

$0; //Assume the line is low for the first sample
[preamble];s"Hello there!    "; //Write the preamble and a string of 16 chars with the bits written LSB to MSB
=10; //Leave the line on the same state at least for 10 samples
[preamble];S"L1\r\nL2          "; //Again, preamble and another string but this time written MSB to LSB
=10; //Leave the line on the same state at least for 10 samples
[preamble];{b0xAA,b0x55}8; //Write a preamble and 16 bytes (alternating 0xAA and 0x55)
=10; //Leave the line on the same state at least for 10 samples
As you can see now our task of creating complex signals become a lot easier.
Once the replay capability gets implemented I plan to extend this language even more, to include shorts, integers and longs at least, and may be even templates so we can for example describe more easily things like the RS-232 protocol, right now you must write the start and stop condition before and after each byte, so each string will be one char long, with a template we will define special groups that will be added before each byte of the data used by a template.
This is the final section of this document and explains how to create your own protocol analyzers. It is intended for those who would like to extend the capabilities of the LogicAnalyzer software.
To implement a custom protocol analyzer I recommend to use the current solution and add the new analyzer as a project to it.
First we must create a Dll project targeting .net 7.0 and it must reference the LogicAnalyzer project. Once our project is ready we must create at least a class that derives of "LogicAnalyzer.Protocols.ProtocolAnalyzerBase".
This class must implement these members:
public abstract class ProtocolAnalyzerBase
{
    /// <summary>
    /// Protocol name to show in the menu
    /// </summary>
    public abstract string ProtocolName { get; }
    /// <summary>
    /// List of settings needed by the analyzer
    /// </summary>
    public abstract ProtocolAnalyzerSetting[] Settings { get; }
    /// <summary>
    /// List of signals used by the protocol analyzer
    /// </summary>
    public abstract ProtocolAnalyzerSignal[] Signals { get; }
    /// <summary>
    /// Validates if settings are correct
    /// </summary>
    /// <param name="SelectedSettings">Settings to validate</param>
    /// <param name="SelectedChannels">Selected channels</param>
    /// <returns>True if the settins and signals are correct, false in other case</returns>
    public abstract bool ValidateSettings(ProtocolAnalyzerSettingValue[] SelectedSettings, ProtocolAnalyzerSelectedChannel[] SelectedChannels);
    /// <summary>
    /// Analyzes a set of samples
    /// </summary>
    /// <param name="SelectedSettings">Settings to use to analyze the protocol</param>
    /// <param name="SelectedChannels">Channels to analyze</param>
    /// <returns>An array of analyzed channels</returns>
    public abstract ProtocolAnalyzedChannel[] Analyze(int SamplingRate, int TriggerSample, ProtocolAnalyzerSettingValue[] SelectedSettings, ProtocolAnalyzerSelectedChannel[] SelectedChannels);

}
The first interesting property to implement is the array of settings that our analyzer will present to the user. These are described by the "ProtocolAnalyzerSetting" class. This class contains these properties:
public class ProtocolAnalyzerSetting
{
    /// <summary>
    /// Caption to show in the GIU
    /// </summary>
    public string Caption { get; set; } = "";
    /// <summary>
    /// Type of setting
    /// </summary>
    public ProtocolAnalyzerSettingType SettingType { get; set; }
    /// <summary>
    /// If SettingType is of type "list" this array must contain the list entries
    /// </summary>
    public string[]? ListValues { get; set; }
    /// <summary>
    /// If SettingType is of type "integer" this property must contain the maximum allowed value
    /// </summary>
    public int IntegerMaximumValue { get; set; } = 0;
    /// <summary>
    /// If SettingType is of type "integer" this property must contain the minimum allowed value
    /// </summary>
    public int IntegerMinimumValue { get; set; } = 100;
    /// <summary>
    /// If SettingType is of type "boolean" this property contains the text shown in the checkbox
    /// </summary>
    public string CheckCaption { get; set; } = "";

    public enum ProtocolAnalyzerSettingType
    {
        /// <summary>
        /// A boolean setting, represented as a checkbox
        /// </summary>
        Boolean,
        /// <summary>
        /// An integer setting, represented by a numeric up/down box
        /// </summary>
        Integer,
        /// <summary>
        /// A list setting, represented by a dropdown list
        /// </summary>
        List
    }
}
The properties are very straightforward and the comments explain each one. The most remarkable is that we can have three kinds of settings: a boolean value, an integer number or a list of values.
A boolean setting will be represented in the GUI as a checkbox, an integer as a NumericUpDown field and a list as a DropDown list.
After the settings we must define which signals we need to analyze a protocol. These are described using the class "ProtocolAnalyzerSignal":
public class ProtocolAnalyzerSignal
{
    //Name to show in the GUI
    public string SignalName { get; set; }
    //If true the signal must be provided, else the signal is optional
    public bool Required { get; set; }
}
As we can see it is self-explanatory, a name to be shown and an indication if the signal is optional or not.
Before invoking the analysis function the validation function (ValidateSettings) will be called with the settings that the user has selected, these will come represented by the "ProtocolAnalyzerSettingValue" and "ProtocolAnalyzerSelectedChannel" classes. If the provided settings and channels are correct we must return a true, else a false.
The selected settings will be encapsulated into an array of ProtocolAnalyzerSettingValue classes:
public class ProtocolAnalyzerSettingValue
{
    //Index of the setting, as provided in the settings array
    public int SettingIndex { get; set; }
    //The selected value
    public object? Value { get; set; }
}
Again, the class is self explanatory, it will contain the index of the setting as it was provided in the settings array and an object containing the selected value.
Each selected channel will be encapsulated into an array of ProtocolAnalyzerSelectedChannel classes, but the Samples array will be empty:
public class ProtocolAnalyzerSelectedChannel
{
    //Signal name for which the channel was selected
    public string SignalName { get; set; }
    //Channel index in the channel viewer
    public int ChannelIndex { get; set; }
    //List of samples
    public byte[] Samples { get; set; }
}
We must ensure that we have the channels that we need, the GUI will enforce the channels that are required but optional channels should be checked by the validate function to ensure that we don't have an invalid combination of optional channels.
Once the settings are validated the analysis function (Analyze) will be called. This will receive the settings and the channels that we already have validated, but this time the samples will be filled. The samples will be a zero or a one depending if the line was low or high for the sample.
The analyze function will also receive the sampling rate at which the capture was done and also the trigger sample, this info is useful to determine sampling periods and where to start analyzing data if we want to skip pre-samples.
Once the signals are analyzed we must return an array of analyzed channels, these do not need to match the number of channels that we have received, and will contain only those channels where we want to show data.
An analyzed channel is represented by the ProtocolAnalyzedChannel class:
public class ProtocolAnalyzedChannel : ProtocolAnalyzerSelectedChannel, IDisposable
{
    /// <summary>
    /// Constructor
    /// </summary>
    /// <param name="SignalName">Name of the signal that represents the channel</param>
    /// <param name="ChannelIndex">Channel index, the same that has been received in the ProtocolAnalyzerSelectedChannel</param>
    /// <param name="SegmentRenderer">Overlay data renderer</param>
    /// <param name="Segments">Segments to render</param>
    /// <param name="ForeColor">Fore color used by the renderer</param>
    /// <param name="BackColor">Background color used by the renderer</param>
    public ProtocolAnalyzedChannel(string SignalName, int ChannelIndex, ProtocolAnalyzerSegmentRendererBase SegmentRenderer, ProtocolAnalyzerDataSegment[] Segments, Color ForeColor, Color BackColor)
    {
        this.SignalName = SignalName;
        this.ChannelIndex = ChannelIndex;
        this.SegmentRenderer = SegmentRenderer;
        this.Segments = Segments;
        this.ForeColor = ForeColor;
        this.BackColor = BackColor;

    }
    /// <summary>
    /// Instance of the segment renderer
    /// </summary>
    public virtual ProtocolAnalyzerSegmentRendererBase SegmentRenderer { get; set; }
    /// <summary>
    /// Array of segments to render
    /// </summary>
    public virtual ProtocolAnalyzerDataSegment[] Segments { get; set; }
    /// <summary>
    /// Foreground color used by the renderer
    /// </summary>
    public virtual Color ForeColor { get; set; }
    /// <summary>
    /// Background color used by the renderer
    /// </summary>
    public virtual Color BackColor { get; set; }

    /// <summary>
    /// Function called by the program to render a segment
    /// </summary>
    /// <param name="Segment"></param>
    /// <param name="Context"></param>
    /// <param name="RenderArea"></param>
    public virtual void Render(ProtocolAnalyzerDataSegment Segment, DrawingContext Context, Rect RenderArea)
    {
        SegmentRenderer.RenderSegment(this, Segment, Context, RenderArea);
    }
    public virtual void Dispose()
    {

    }
}
The class can be used as-is, it provides the required fields and functions but if you will need to do some extra tasks you can inherit from it and override any property or function that you like.
The constructor requires six parameters: the signal name, the channel index, the segment renderer, the list of segments and the fore and back colors.
To overlay the data over the channels the provided renderer will be called for each segment that becomes visible on the screen. More info will be provided in the next section. There is a pre-made renderer (the one used by all the current protocols) called "SimpleSegmentRenderer", you can provide an instance of this renderer unless you want to use another kind of representation.
The overlayed data is represented as a data segment, these are encapsulated in the ProtocolAnalyzerDataSegment.
public class ProtocolAnalyzerDataSegment
{
    /// <summary>
    /// Initial sample of the segment
    /// </summary>
    public int FirstSample { get; set; }
    /// <summary>
    /// Final sample of the segment
    /// </summary>
    public int LastSample { get; set; }
    /// <summary>
    /// Value to render in the segment
    /// </summary>
    public string Value { get; set; }
}
Again, all very self explanatory, we provide in which sample the segment starts, in which sample the segment ends and finally the string to be rendered.
As has been already explained the program contains a basic renderer that will be sufficient for the majority of the cases, but if you want to render more complex data representations you can implement your own renderer. To create a custom renderer you must implement the base class ProtocolAnalyzerSegmentRendererBase:
public abstract class ProtocolAnalyzerSegmentRendererBase
{
    /// <summary>
    /// Function called to render an on-screen segment
    /// </summary>
    /// <param name="Channel">Analyzed channel where the data will be rendered</param>
    /// <param name="Segment">Segment to render</param>
    /// <param name="Context">Graphics context</param>
    /// <param name="RenderArea">Rectangle where the segment must be rendered</param>
    public abstract void RenderSegment(ProtocolAnalyzedChannel Channel, ProtocolAnalyzerDataSegment Segment, DrawingContext Context, Rect RenderArea);
}
The renderer must at least implement the RenderSegment function, this will be called each time that a segment must be rendered on screen. The function will receive the analyzed channel, the segment to render, an Avalonia UI DrawingContext and a Rect with the coordinates of the segment in screen.
What your renderer does with this information is up to you, you can render a simple string, create complex polygons, render images or whatever you need, but keep in mind that these will be executed each time the user forces a redraw of the sample viewer, by scrolling it, changign the number of on-screen samples or by trashing the render surface.
The installation is very simple, compile your analyzer, get the resulting Dll and place it in the "analyzers" folder of the application. Once you restart the program it will detect the new analyzer and will be available in the "Protocol analyzers" menu.
This program has been the result of a lot of work, I'm a single developer and I have designed and programmed everything by myself. It has a lot of room for improvements so if you want to help in the development of the software or have ideas that you think that can be useful for it don't hesitate to leave a comment in the discussion section or open an issue if you find any kind of bug.
Hope you enjoy it!
(C) 2023 - El Dr. Gusman.