App Goal: To take Driverless AI or H2O-3 STEAM Usage logs and generate Insights
Target Audience: H2O SE/AE/CSM/TAM, Customers
Industry: Horizontal
Actively Being Maintained: Yes
Last Updated: Jan 26, 2024 - to work with wave 1.0.0
Comes with Demo Mode (pre-loaded data, models, results, etc.): No
Allows for Uploading and Using New Data: Yes
Features:
- Upload feature for uploading a driverless-report*.csv file
- Group by on key fields to get row counts
- Generate KPI Dashboard, Visuals
- Download Usage Summary/Daily Peak Usage data
- Choose timeline to filter rows for above to tell usage story
GitHub: http://www.github.com/h2oai/steam-stat
Author: karthik.guruswamy@h2o.ai
You need to be an Admin on Steam to access the logs. See below on where to get it from:

Its a CSV file that has the name driverless-report-xyz.csv
It should have the entire historical usage of Driverless AI start/stops.
The main dashboard (after you upload the logs), shows you the logs themselves, which you can scroll/sort/group by on any column etc.,
The "Peak usage by the day" table basically breaks down day level information on the entire range of the data. Basically you get "Peak Sessions", "Peak CPUs", "Peak GPUs", "Unique Users" etc.,
Sessions: A session is basically a record in the log that represents the duration of a 'start'/'stop' event of a Driverless AI or H2O-3 instance. Depending on the workload, the session can last anywhere from a few minutes to a few days! So basically our reports chops those sessions into day activities and you get rollups per day!
The Summary table shows you the following info for the entire log duration:
- Log Start
- Log End
- Total Hours of use
- Total Sessions
- # of Unique users
- Max Daily Users
- Max Daily CPUs
- Max Daily GPUs
- # of Days that there were no sessions ! (inactive day basically)
Both the Peak Usage and Summary information can be downloaded into a CSV, so you can format/chart it in Excel or an Editor of your choice.
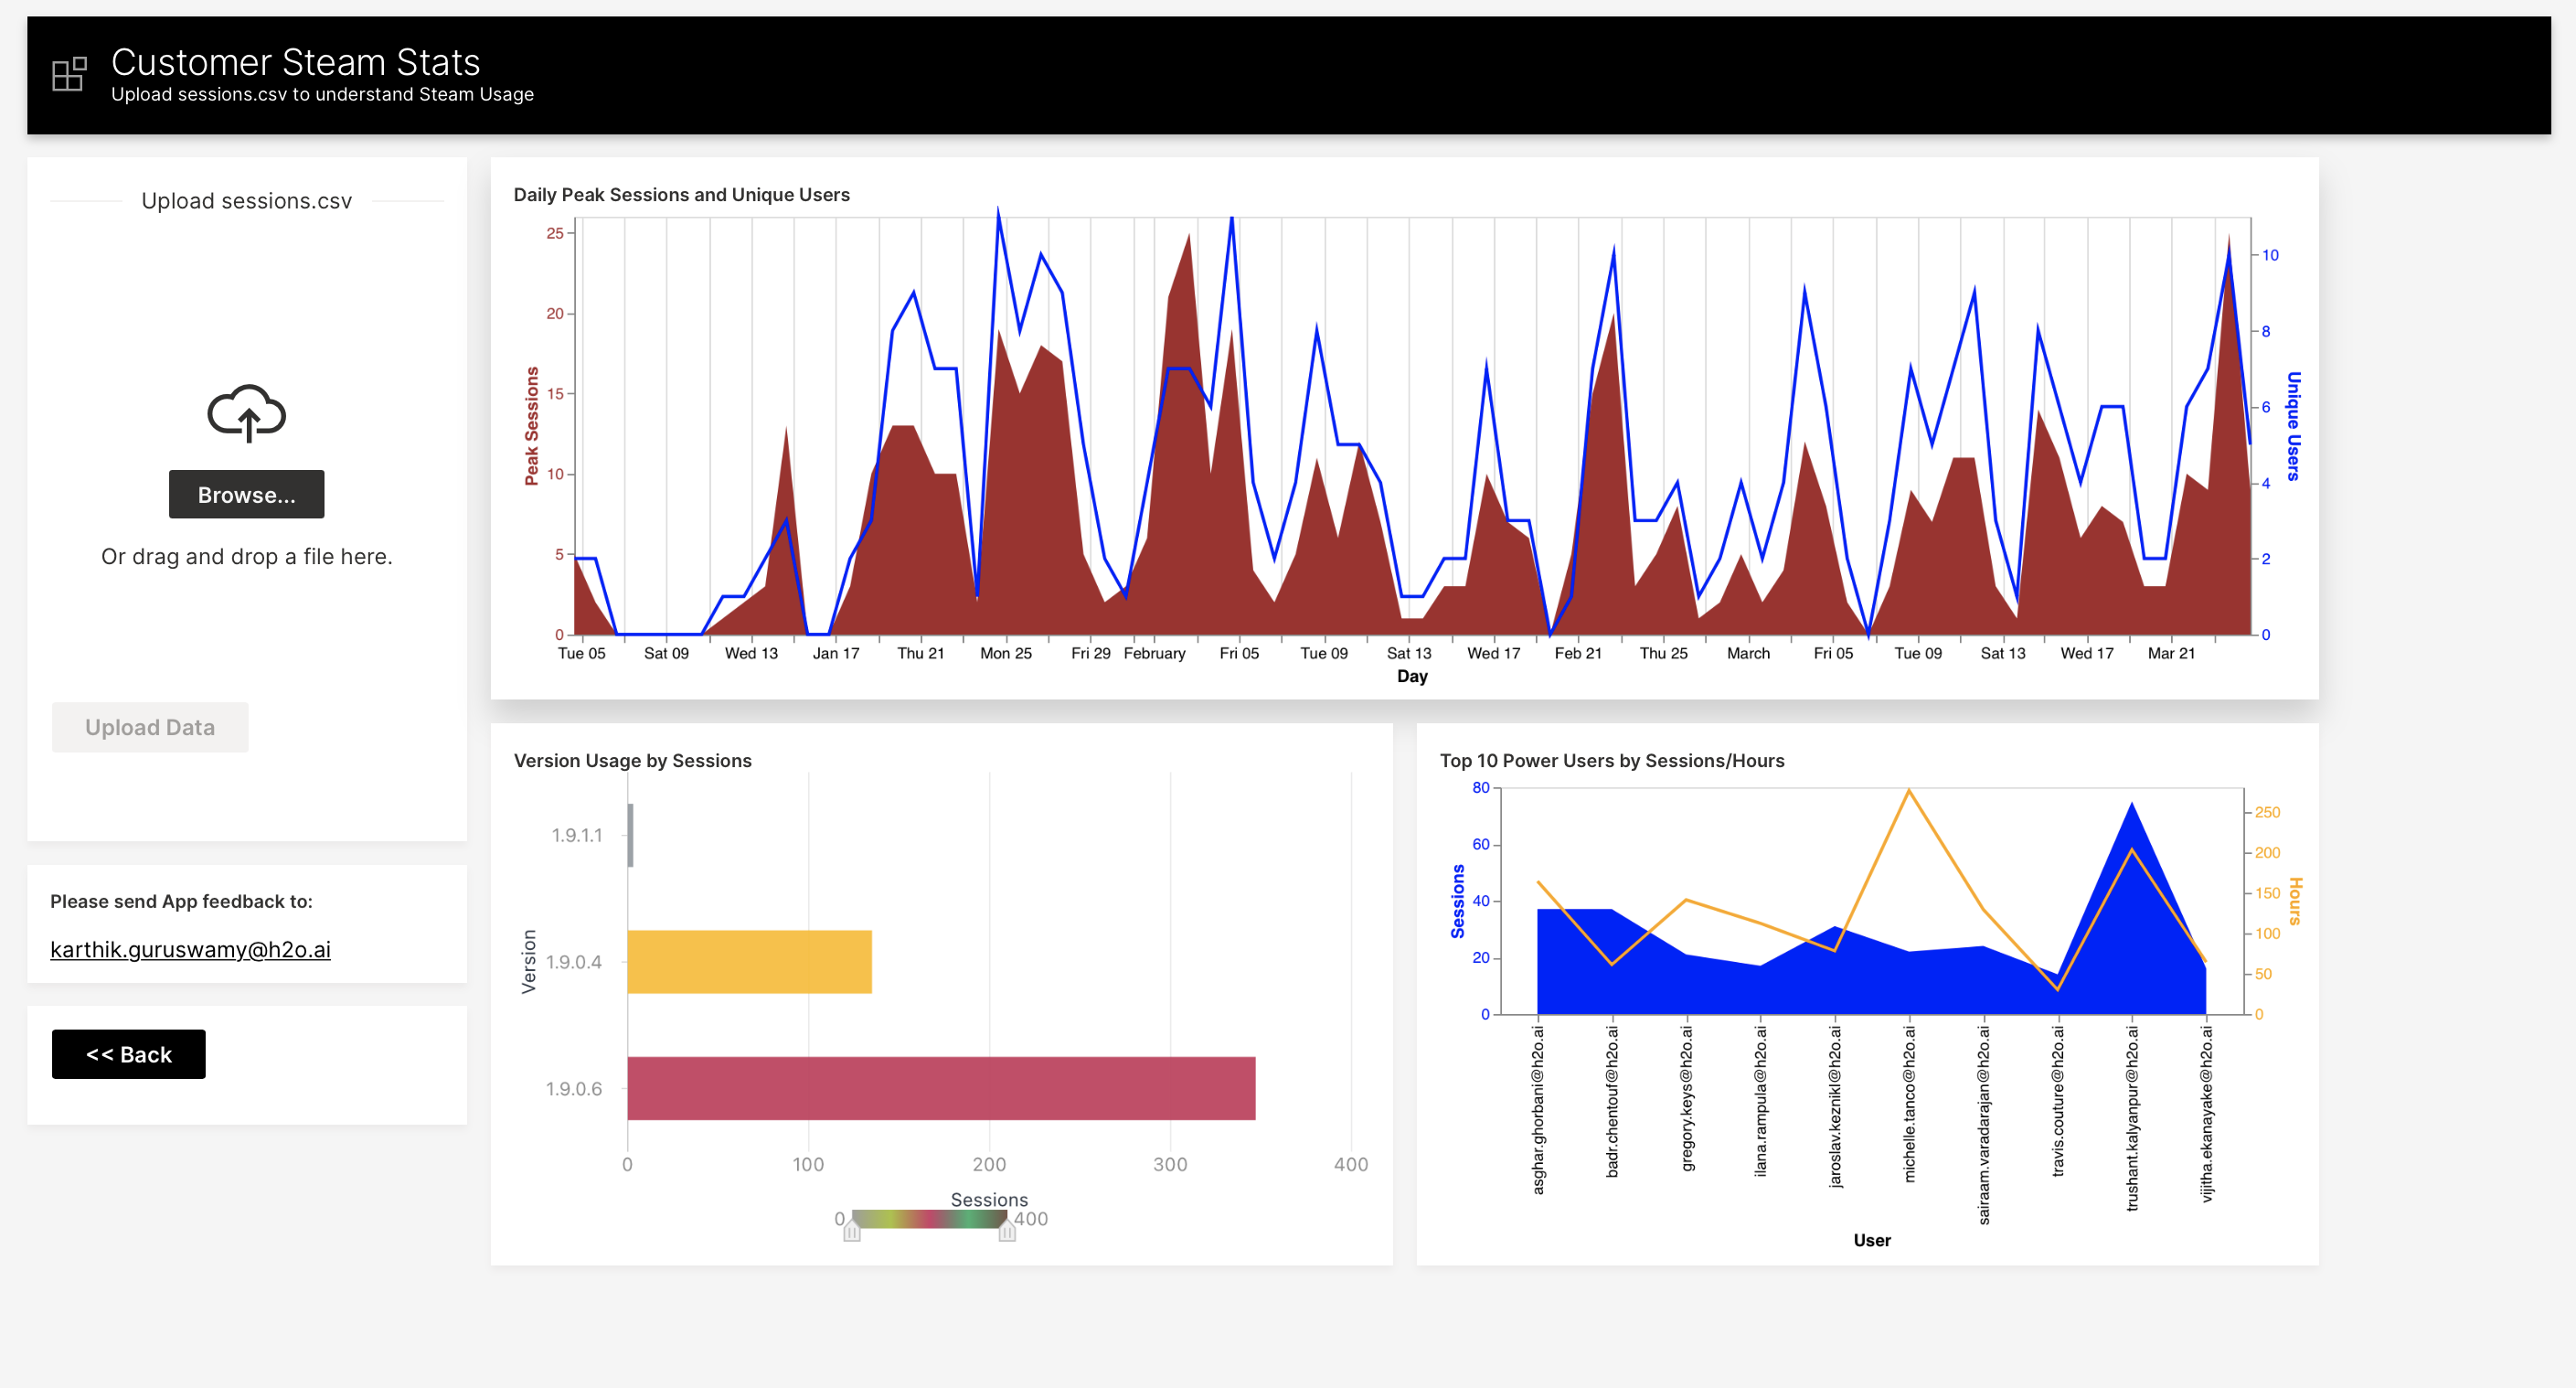
You can also get insights using drill down charts to see:
Unique users and Peak Sessions (basically day level count) for each day in the log duration - including days that there was no activity. You can also see the how many sessions were present across different versions of Driverless AI and H2O-3 installed on Steam
The top 10 power users in terms of in terms of # of Sessions and # of hours used is also available as chart
- Create a virtualenv python 3.10 and above (which worked for me) and activate an environment
- Run
pip install -r requirements.txt - Get latest wave - you can get it with pip install above. I tested with h2o wave 1.0.0
- Run waved (wave server)
- Run
wave run --no-reload steam_stats.py - Go to http:<localhost|server ip>:10101

- Get your steam logs from Steam (need admin account) and Click Browse and Upload to upload the log to the App
- View main Dashboard

You can also use the Filter Timeline feature on the left , to filter rows based on various time periods, to compare usage, power users etc.,
9. Click "Drilldown" on the left to get nice graphs!
10. Hit "Back" to go back to main Dashboard
Bugs: Just file an issue from "issues" tab with a screenshot
Feature Request: Need info. on what kind of chart or table or a rollup would be interesting in your deployment. If the logs support underlying data, it should be easy for me to add that to the code. In most cases, you should be able to change the code yourself :) and let me know what you did and Im happy to merge that to the main code if it makes sense.