HiGrads is a GrADS script library which helps compose Grads subplot in an easy way as well as provide some additional chart plotting functions. HiGrads is created initially for generating higher quality figures using GrADS for paper publishing during my Postdoctoral research at Kyoto University.
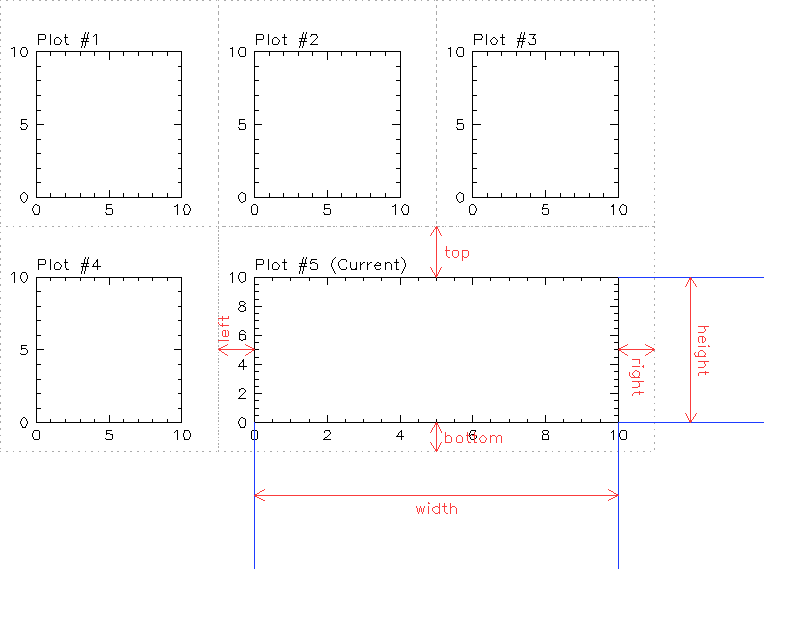
The figure below shows the fundamental concept of frames in HiGrads approach. Each frame is considered a block, which is placed adjacent to each other. This concept is borrowed from CSS’s box model, which is standard in web design. Beside the plotting area dimensions (width & height), a box has four margins (top, right, bottom, left). The code to generated this plot is just about 60 lines of code and is included in the library (h_demo.gs).
##A crash course
You just need to unpack the library (zip file) and copy all the files to GrADs library. For easy maintenance, all HiGrads files have the prefix h_.
Then, you can test HiGrads by open GrADS (portrait mode recommended) and type h_test
grads -p
h_test
If you get the following plot, then HiGrads work!

You can open file h_test.gs which included in the library to have a glance of how short and easy the plot is made. There is even not needed any data file! In the next section, we will go on a short tutorial of how these things work.
HiGrads is exclusively written for GrADS script which in general, you cannot use from GrADS command windows but in a GrADS script (.gs) file. In a .gs file, you need to enable grads script function by the following code:
r=gsfallow('on')
The first step, you need to initialize everything
h_initframe()
This function might take a parameter: 'l2r' (default): frames are places from left to right, 't2b': frames are place from top to bottom
Define a new frame, you can use function h_newframe(w,h). Where w & h are width & height parameters in inches (remember, GrADS page size is either 11x8.5 inches or 8.5x11 inches depends on landscape or portrait mode). For examples:
h_newframe(3,3)
Means that you define a box with w=3 and h=3 inches. After using that function, every GrADS display commands will be bound in the plotting area of that box. To create a new box, you can simply call h_newframe again (with same or different parameters).
What about margin? Well, all margins take the default values of 0.5 inches. To manage the margin of the frame, you use the function h_setmargin(top,right,bottom,left) before h_newframe. (Remember the first is the top, then run clockwise direction, similar to CSS margin). For example:
h_setmargin(0.5,0.2,0.5,0.5)
Will set right margin to 0.2, while all other margin is 0.5 inch
If all the margins have the same value, e.g. 0.3, you only need to set h_setmargin(0.3). If you set h_setmargin(0.3,0.1), that means top and bottom =0.2, left = right=0.1
If every frame has the same margins, you only need to set it once.
Now, try putting everything together (example1.gs).
First, we reinitialize everything and open data file, init HiGrads and set default margins
'set display color white '; 'c'
'open model.ctl'

r=gsfallow('on')
h_initframe()
h_set_margin(0.5,0.2,0.5,0.5)
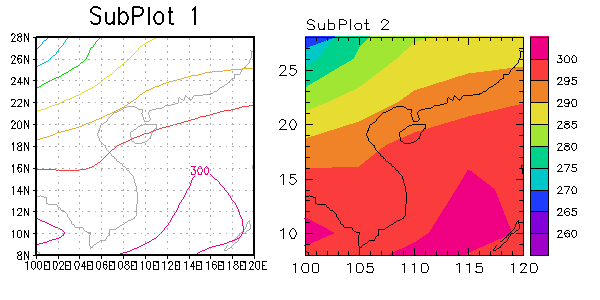
We intend to have 2 equal subplots with w=3 & h=3. Total horizontal spaced needed will be the width of the two (6 inches), Plus the margins (0.5 + 0.2 + 0.5 + 0.2 = 1.4), in total = 7.4, so that we know it will fit on portrait paper (w=8.5) )
h_newframe(3,3)
'set lat 8 28'; 'set lon 100 120'  ;* I set an *squared* around Vietnam
'set mproj scaled'                 ;* this force the plot using the whole defined space
'd tsfc'
'draw title SubPlot 1'
The subplot is in position as expected, now the next subplot. But the tick marks and labels are quite small and dense, and I don't like the lattitude and longitude lines. So we will use the HiGrads function for the next subplot
h_newframe(3,3)
h_nodefault()
'set gxout shaded'
'd tsfc'
h_set_xrange(100,120)
h_set_yrange(8,28)
h_draw_xtm(90,120,1,5)
h_draw_ytm(5,30,1,5)
h_draw_ltitle('SubPlot 2')
h_cbarn('r',0,0.1)
There are some new HiGrads functions (h_) are envolved here.
First, h_nodefault indicated that we will not use default tick marks of grads. In order to use HiGrads ticks marks, we need to define the X and Y coordinates by h_set_xrange(x1,x2) and h_set_yrange(y1,y2). You may add the 3rd parameter (optional) which can take either linear (default) or log (for lograrithm scale), see h_test.gs for a demonstration of how to use it.
Then h_draw_xtm and h_draw_ytm will handle the tick marks drawing. h_draw_xtm and h_draw_ytm take 4 parameters, (start, end, increment, major), which mean it will draw minor ticks from start every increment value through end, major ticks and labels are drawn every major ticks mark.
h_draw_ltitle is for drawing a left-aligned title (similarly, h_draw_rtitle is for right-aligned title).
The last one is 'h_cbarn' function to display the color scale. It has 3 parameters, the first is either 'r' or 'b', which means right or bottom position, the second (optional) is the offset of position, the 3rd (optional) is the font size.
The plot should look like this
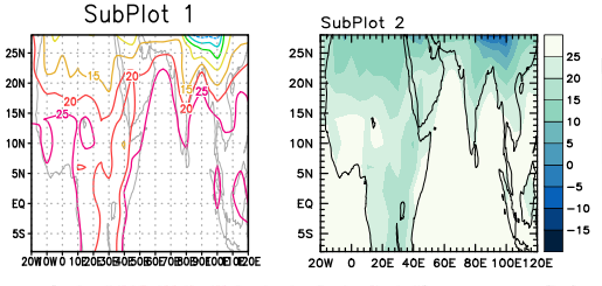
Adding options for displaying lat/lon (see example1.gs for details) and change the color scale by using h_rgb command, we got
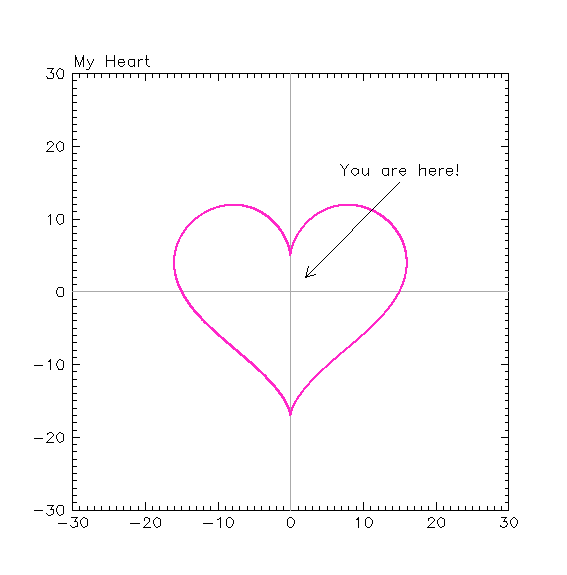
To understand more about HiGrads, let's draw a chart, and it must be an interesting one! So we are going to draw this set of equation
x = 16sin^3(t)
y = 13cos(t) - 5cos(2t) - 2cos(3t) - cos(4t)
where t ranges from 0 to 2Pi
First step, set up a 6x6 inches plot with range from -30 to 30 for both x and y coordinates and draw the basic tick marks plus two gray lines through the origin
'set display color white '; 'c'
r=gsfallow('on')
h_initframe()
h_set_margin(1)
h_newframe(6,6)
h_set_xrange(-30,30); h_set_yrange(-30,30)
h_draw_xtm(-30,30,1,10);h_draw_ytm(-30,30,1,10)
'set line 15 1 1';
h_draw_line(-30,0,30,0)
h_draw_line(0,-30,0,30)
h_draw_ltitle('My Heart')
Now we will draw the chart using function h_draw_line. This functions similar to draw line command in GrADS, but far more powerful because it cause draw directly on chart coordinates (default) Or physical coordinates and you can set the arrowhead at the start, end, or both. Please refer to HiGrads function descriptions for more details about this.
pi=4*math_atan(1)
dt=0.001
'set rgb 16 255 40 200'
'set line 16 1 6'
t=0; while(t<=2*pi)
   x=16*math_pow(math_sin(t),3)
   y=13*math_cos(t) - 5*math_cos(2*t) - 2*math_cos(3*t) - math_cos(4*t)
   if (t>0)
      h_draw_line(x_o,y_o,x,y)
   endif
   x_o=x; y_o=y
t=t+dt; endwhile
Final small touch!
*draw the arrow
'set line 1 1 1'
h_draw_line(2,2,15,15,1,'s')
px=h_get_px(15); py=h_get_py(15)+0.1
'set string 1 bc'
'draw string 'px' 'py' You are here!'
Now running the script (example2.gs), you should get a nice animation drawing the heart (because we set dt to a very small value) and this is the final result which you can print out during Valentine day as a present and prove that science is not so boring ;)
You may notice two functions, h_get_px(x) and h_get_py(y), which convert chart coordinate to plotting/physical/paper coordinates. The counterpart of the two are h_get_x(px) and h_get_y(px) will convert from paper coordinates to chart coordinates.
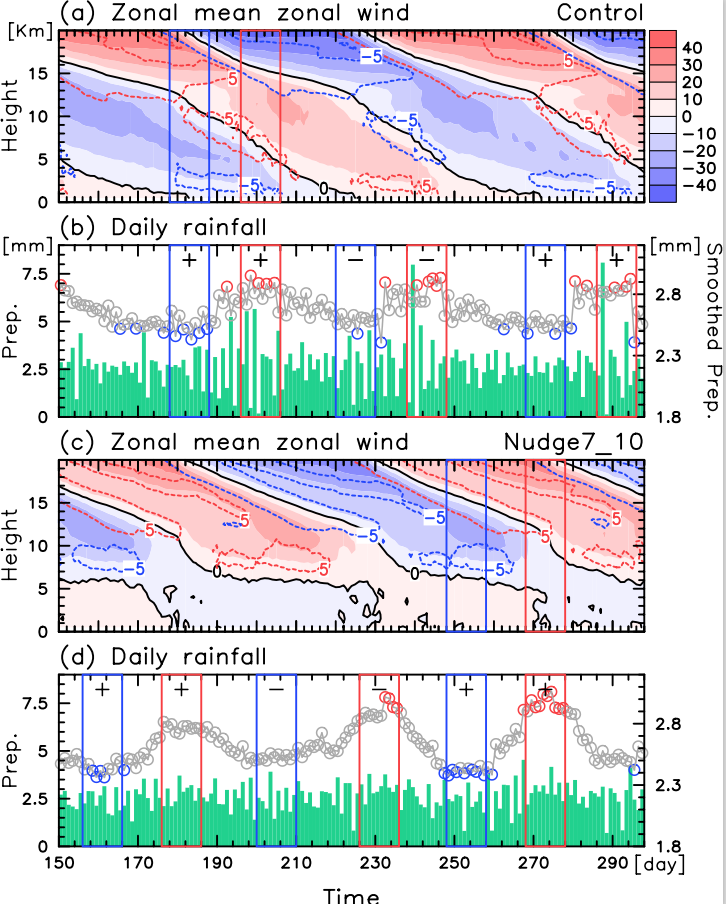
Example 1 - a plot of a time-height section of zonal mean zonal wind, shear, 1-day rainfall & running average rainfall. This plot has 4 subplots with some drawing functions (h_draw_mark, h_draw_line, h_draw_rect)
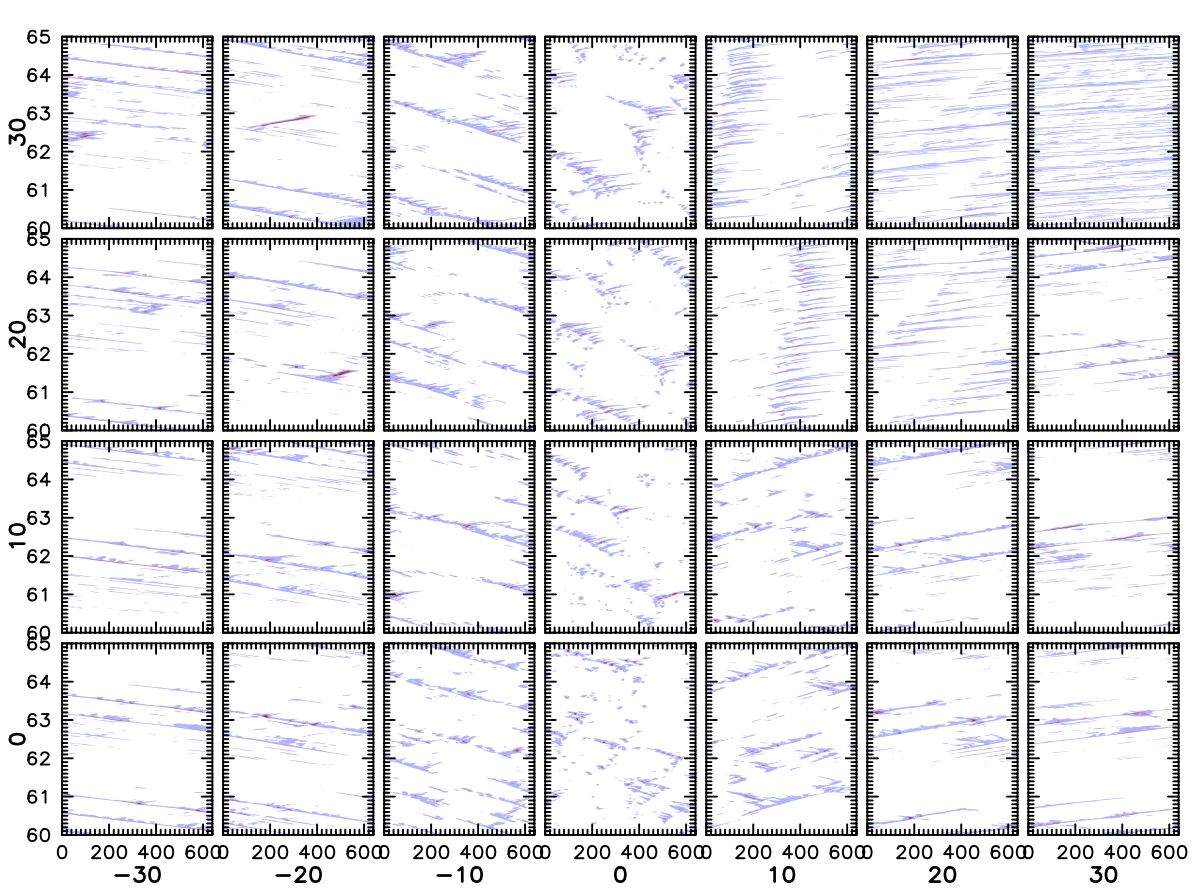
Example 2 - a plot contains 28 subplots of Hovmoller diagrams, notice the axis label in between is omitted to saving the space.
h_initframe(order,debug)   ;*This must be called from the start. order is optional:'l2r' (default) or 't2b'   debug is optional, default=0,=1 will show the block real border
h_set_margin(t,r,b,l)  ;*set margin similar to CSS styles, units in inches
h_newframe(w,h)   ;*Define a new appending block
h_floatframe(w,h,x1,y1)  ;*Defina a floating block, x1 & y1 is the left-bottom corner coornidate in inches
h_break()  ;* put the block to the next row instead of appending
h_set_xrange(xmin,xmax,type)  ;*set the range for x coordinates, type is either 'linear' or 'log'
h_set_yrange(ymin,ymax,type)  ;*similar to h_set_xrange for y coordinates
h_get_px(x)   ;*from chart coordiates --> paper/plot coordinates (inches)
h_get_py(y)
h_get_x(px)   ;*from  paper/plot coordinates (inches) --> chart coordiates
h_get_y(py)
:h_draw_xtm(min,max,dx,maj,siz,offset) ;*draw tick marks
h_draw_ytm(min,max,dy,maj,siz)

h_draw_title(title,thick,size,offset)  ;*draw title, left, and right-aligned titles
h_draw_ltitle(title,thick,size,offset)
h_draw_rtitle(title,thick,size,offset)

h_draw_xlab(title, thick, size, offset)   ;*draw chart lables
h_draw_ylab(title, thick, size, offset)
h_draw_string(vx,vy,string,offset_x,offset_y)  ;* draw string, vx,vy is in chart coordinates, offsets in inches
h_draw_mark(vx,vy,type,size)  ;* draw mark, vx, vy in chart coordinates
h_draw_line(x1,y1,x2,y2,onchart,arrow,angle,head)  ;*draw line/arrow, onchart=1-->use chart coordinates (default),=0: use paper coordinates; arrow=0: no arrow, ='s': arrow at start,='e', arrow at end, ='se' arrow at both ends, head & angle define arrow shape
h_draw_rect(x1,y1,x2,y2,linecolor,bgcolor)
h_cbarn(pos,offset,sz) ;*similar to cbarn, pos='b' for bottom possition,='r' for right. offset in inch from default position, sz is string size.
h_demo() ;*A demo script to test higrads functionality
Global variables are used accross higrads functions, you can use them directly if needed but don't change their value.
| Variable name | Meanings |
|---|---|
| _debug | Debuging flag |
| _x1,_x2,_y1,y2 | Paper coordinates (in inches) of current bounding box |
| _px1,_px2,_py1,_py1 | Paper coordinates (in inches) of current chart |
| _y1min | The lowest coordinate |
| _top, _right, _bottom, _left | Box margins (in inches) |
| _xmin, _xmin, _ymin, _ymax | Range of chart coordinates |
| _ax,_bx,_apx,_bpx,_xscale,_yscale | Coeficent for coordinates, DON'T mess with these! |