![]()
Uncertainty Research (UR) outlines a preliminary capability to identify below-market opportunities to purchase residential properties. A hypothetical Real-Estate Investment Trust (REIT) seeks to enter residential real-estate rental market. The business model is described in [R. Dizember, L. Kuzisto, WSJ, July 21, 2017], [A. Semuels, The Atlantic, February 13, 2019], and elsewhere.
Two aspects of this operating model tend to deliver higher profitability than conventional landlords managing individual or small numbers of properties. First, such funds purchase their assets using cash. This gives them advantages over would-be owner/occupants dependendent on financing. Second, they transfer costs to tenents that are conventionally borne by landlords. Tenants, for example, sometimes assume resonsibility for some maintenance costs.

The image to the left illustrates the overall Concept for Operations. REITs' purchasers look for listings that are priced below the prevailing market. The spot-market pricing model provides estimates of the "should-cost" price. When a below-market price is detected, buyers apply other information and apply it to a total-ownership cost model. This feeds a decision framework as whether to invest.
This work addresses the initial component for the Spot-Market Pricing Model component. The model considers 77 characteristics of each property. The discussion below elaborates on technical details. The prototype predictive model for spot-market pricing demonstrated here accounts for approximately 90% of the variation in sales price in the Ames, IA market. Prices for outlier properties — exemplified by large-footprint properties in less-expensive neighborhoods — are estimated with less accuracy.

Uncertainty Research's (UR's) delivery method is based on the Cross-Industry Standard Process – Data Mining (CRISP–DM). The figure to the right provides an overview. This method has provided the foundation for delivery methods used by many leading technology firms, including IBM.
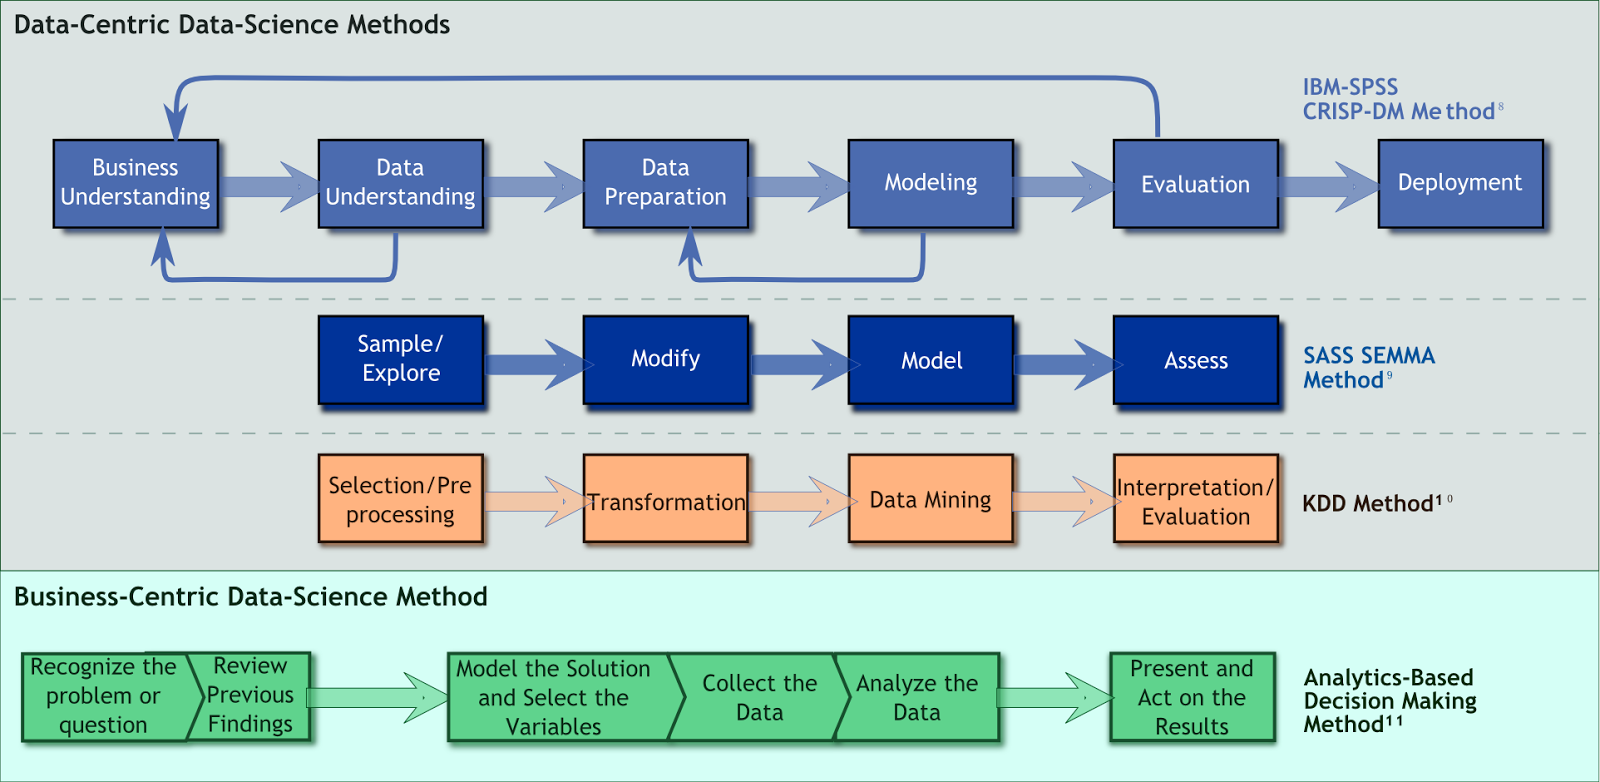
UR employs CRISP–DM because it contains more-direct coupling to the business context than some more data-centric methods. It also provides more-explicit guidance on iterativity, an inescapable part of modeling. The following subsections summarize its application in this work.
The figure in the executive summary above summarizes the concept of operations for a hypothetical REIT. It seeks to find residential properties that are priced below the market by a certain probability threshold. Then, based on a total ownership cost model, REIT asset purchasers receive recommendations whether to purchase a given property. The REIT then becomes an absentee landlord. It rents the property out to qualified tenants.
Here, we use a prototypical data set from a well-known kaggle challenge. An actual solution would obtain real-time updates from a site such as Bright MLS Homes, or possibly Zillow.
The work summarized here represents the first step in the Spot-market pricing model component of the workflow. We prototype here the ability to estimate the should-cost price of a home. We focus at this stage on point estimates. We extend this in subseqent work to estimated probability distributions of expected prices. This allows us to identify a below-market price-probability threshold, at which the REIT might elect to buy.
The total ownership-cost model estimates a distribution for the net-present-value (NPV) including all projected rental income and costs except, for the acquisition costs. This is based on a discounted cash-flow (DCF) analysis of expected costs such as taxes, maintenance, and insurance. DCF is a foundational practice in financial accounting (e.g., [Pratt, 2016], [Libby, et al, 2019], [Brealey, et al, 2020]).
Finally, an automated decision-making framework provides REIT asset-portfolio managers with recommendations regarding whether to attempt a purchase of a given property. The decision model follows from well-established methods from the decision sciences (e.g., [Saaty, 2013], [Kochenderfer, 2015], [Skalna, et al, 2015], [Howard, 2015]). We will feed our decision-science method with inputs from data-science and financial modeling.
For each stage in the foregoing purchasing-decision framework, subsequent work will estimate probability distributions for the influential factors. These are inferred fitting estimation-error residuals to emprical probability distributions (e.g., [Keelin, 2016]), where possible. In some cases they might be elicited from experts through a process resembling that described by [Spetzler, 1975]. The overall framework is designed using a probabilistic approach [Walsh, 2020].
Our prototypical data set comes from a well-known kaggle challenge. The figure below summarizes statistics from the data dictionary, included as an appendix to the end of this report. We begin with a flat table containing 2,051 records with 83 attributes each.

Most-significantly, we begin with numerous incomplete records. Our data-completeness analysis looks across both observation and attribute dimensions. We see a small number of of records for which many features are missing. We also see some attributes for which pluralities of records lack values.
Our missing-value handling for this exploratory stage is simple. We discard the attributes for which large proportions of values are missing. Then we discard observations with null-valued attributes. The data dictionary in the Appendix below describes attribute-by-attribute our handling of missing values. A more-systematic missing-value-handling procedure awaits subsequent stages of this work.
The analysis also shows the different attribute categories in the data. We have continuous, discrete, and categorical attributes. The discrete attributes are either numeric measurements recorded at integer granularity, or ordinal variables. We do not distinguish between them here. The continuous variable SalePrice is our response (target) variable.

The dimensionality of our explantory-variable space is considerable. We suffer from the risk of the curse of dimensionality [Hastie, et al, 2009, §2.5]. This becomes particularly acute considering our the number of categorical attributes. When we dummify the these variables — e.g., [pandas.get_dummies()] — the attribute dimensionality becomes multiples greater.
We seek therefore to pare the attribute space. We pair-wise analyze each explanatory variable's relationship with the target variable SalesPrice. This is accomplished via two methods. We consider the pair-wise correlations for continuous and discrete variables. The heat-map graphic to the right illustrates for continuous variables. We retain continuous and discrete explanatory variables whose correlation with the response variable exceeds 0.45. This gives us six continous and five discrete influential variables.
Our degree-of-influence analysis for categorical variables is somewhat less-direct. We assume that if a categorical variable is a good predictor of a continuous response variable, then the converse should also be true. So, we construct univariate multinomial logistic-regression models for each categorical variable. We use our SalesPrice response variable as the explanatory variable for each such model. We retain categorical variables for which SalesPrice predicts their class with accuracy exceeding 0.55. This leaves us with 33 influential categorical variables. After dummifying, we end up with 177 explanatory variables, overall.
Finally, as is always recommended in high-dimensional scenarios, we perform dimensionality analysis of our explanatory-variable set. This provides at least two pieces of useful information. First, multicollinearity presents difficulties for regression models, in particular (e.g., [Dielman, 2005, §4.6], [Fox, 2008, chap 13], [Olive, 2017, §3.8]). Regression models can become unstable in the presence of pronounced multicollinearity. In general, knowing the effective dimensions explanatory-variable is very useful.

The figure to the left depicts results from dimensionality analysis of our 177 explanatory variables. This results from singular-value decomposition of our explanatory-variable matrix. This tells us how much of the information in our explanatory variables is actually independent (e.g., [Golub, 1989, §8.3], [Horn, 1985, §7.3.5]).
We find that our 177 explanatory variables are highly dimensionally-dominated. Most of the variance is contained in the first ten or so dimensions. In fact, only four dimensions contain 99% of the overall variance. Theoretically, we should be able to reduce our explanatory-variable dimensionality to just a handfull of dimensions and get the same result, give or take a percent or so, as with using all of them. We do not attempt this here, however.
The vertical-axis plot limits truncate the values for approximately the ten smallest singular values. These have quantities on the order of . The hat matrix —
— for a regression model would be poorly-conditioned (practically singular) in this case. Instability in coefficient values might as a result degrade our ability to intrepret the relative importance of explanatory variables [Cooley, 1971].

We consider a diverse variety of modeling approaches. The figure to the right extends an important summary from [Hastie, et al, 2009, Table 10.1, p. 351]. This table groups the family of mainstream statistical-learning methods into five broad categories. The column headers represent the most-general form of each family of methods.
For example, Multi-Attribute Regression Splines (MARS) represents the most-general form of regression modeling, according to this perspective. Ordinary Least-Squares (OLS) regression is arguably a special case of MARS. This class also contains Generalized Additive Models (GAMs) [Hastie, 1990], which bear considerable resemblance to artificial neural networks using rectifier linear unit (RELU) operators as activation functions.
The rows in the table contain points of view on the strengths and weaknesses associated with each of the methods. The original [Hastie, et al, 2009, Table 10.1] considers nine such factors. The version here has been extended to add three more. This work assigns priemium to predictive power, resistence to overfitting, and conditional probability.
This work attempts to span the families in this table. We however consider slightly different groupings. The first group consists of methods that linearly transform explanatory-variable observations according to an operation resembling . This class includes regression modeling, support-vector machines, artificial neural networks (ANNs), and kernel methods.
The first two explicitly use -type operations in their formulations. ANNs use cascaded
operations of our linear transform. The 𝜙 functions are rectifier linear unit (RELU) operators. ANNs resemble multi-level regression models (e.g., [Gehlman, 2007], [Hox, 2010]) constructed from GAMs instead of linear-regression models.
The kernel methods — to which the kNN regressor belongs — fit less-well into this grouping. They employ transforms of the form . The transform vector 𝝱 however is not uniform across all observations. The kernel methods scan over the explanatory-variable space in a manner resembling a single stage of filtering and pooling in convolutional neural networks [Haykin, 2009, §4.17].

Tree-based methods comprise our second class of methods. These are distinct in that they do not involve -type operations. Alternatively, tree-based methods divide the data using recursive binary partitioning ([Brieman, et al, 1984] [Hastie, et al, 2009, §9.2]). The figure to the left contains an example from [Brieman, et al, 1984, Fig. 2.3].
In a regression context — our case of interest — this produces approximations that are piecewise constant. The partitioning is accomplished in a way that maximally distinguishes groups being separated according to some statistical score. Usually, this is the mean-square error in curve-fitting contexts.
Our analysis here considers four variants of tree-based modeling. We first look for the best model for a basic regression tree. The remaining variants are ensemble methods. The first is a bagging tree. This simply involves creating a bunch of trees from bootstrap samples of the data. The results of the trees are averaged together.
Random Forests extend this smoothing through also randomly selecting from among the feature set [Hastie, et al, 2009, chap 15]. Instead of simply bootstrapping our observation set, we also randomly select the features on which partitioning decisions are based.
Boosted Trees "combines the outputs of many 'weak' estimators to produce a powerful 'committee'" [Hastie, et al, 2009, chap 10]. We "repeatedly grow shallow trees to the residuals, and hence build up an additive model consisting of the sum of trees" [Efron, 2016, Chap 17]. At each iteration, a distinct set of weights is applied to each of the training observations. These weights apply emphasis to the observations for which the greatest error in the previou iterations occured.
Recursive binary partitioning is paradigmatically distinct from modeling in an important aspect. Specifically, it provides a distinct approach to handling of conditional probability. When is conditional probability important? When the phenomena being modeled span scenarios distinguished by substantial heterogeniety. That is, different cases in the phenomena exhibit characteristics that are substantially different, and cannot be handled by the same model or model parameters.

Conditional probability is a key emphasis of Probabilistic Graphical Models (PGMs) (e.g, [Pearl, 1988] [Studený, 2005] [Koller, 2009]). The illustration to the right comes from [Darwiche, 2009, Fig 4.2]. Tree methods address conditional probability obliquely. The binary cursive partitioning breaks observations into groups that are conspicuously distinct based on explanatory-variable values. This often proves a powerful approach to phenomenological heterogeneity.
Alternatively, approaches based on implicitly assume substantial phenomenological homogeniety. Response variables are related to numeric explanatory variables by the same set of slopes in the coefficient vector 𝝱. Distinct categories are handled by translating the intercept.
Consider for example the instance in which an observation belongs to the category. The indicator-function value for that attribute takes unity. The effective intercept — all other variables being equal — becomes
, and our estimate
The slope coeffients
for the numeric explanatory variables are unchanged.
Why might this be problematic? Association with the category might mean that we should have a coefficient vector different from
. Our
-based methods only however only allow a single coefficient vector for all observations. Phenomenological homogeniety is assumed. At best, our model is a compromise that force-fits all of our observations into a single sub-optimal model based on
. At worst, it is completely inappropriate for some subset of our observations.
Tree-based methods get around this by allowing for distinct partitions. Our response-variable estimates are piecewise-constant — the set-member average — for all members of a partition set. These estimates however can take on whatever value is appropriate to the partition-set members. It is unconstrained by force-fitting all observations to a single
. Incidentally, kNN and kernel methods also accomodate phenomenological heterogeneity in their own way.
For each model approach approach we employ the sklearn GridSearchCV package to perform a search over a judiciously-selected hyperparameter space. For each hyper-parameter gridpoint we calculate five-fold cross-validation. The table in the Model Evaluation section below lists the hyperprameters searched, as well as the values for the best models.

Also, we apply a logarithmic transform to the response variable. The figure to the left illustrates our motivation. It contains Kernel-Density Estimates for both the directly-observed and the logarithmically-transformed response-variable SalePrice. Each subplot is also labeled with its skew coefficient γ.
Two aspects of our distributions are significant. First, the log transformation substantially reduces the skewness of the data. Secondly, it dramatically supresses the long upper tail in the SalePrice. Neither distribution passes statistical tests for normality. The log-transformed version is appears however subsantially closer to being Gaussian, a key assumption of linear models.
Most significantly, this transformation suppresses outliers. In our case, the performance with the logarithmic transform is marginally better than previous iterations without. This moreover reduces overfitting. The downside of such transforms is that additional caution is involved in evaluating some statistical-inference metrics.

Some additional manual effort was applied to the linear-regression model. Specifically, the model performance for that approach appeared to be driven by outliers. The figure to the right illustrates. Two particular observations appeared as conspiuous outliers from the rest, in terms of price and living space. These were in the Edwards neighborhood, for which the price distribution does not coincide with that of the overall market. Effort was applied to identify explanatory-variable attributes that drove the outlier estimates.
The table below contains summary statistics for the best model from each approach. It reports squared-error and coefficient-of-determination statistics for each approach. These statistics are commonly used in analysis-of-variance (ANOVA) analysis for regression modelng (e.g., [Sahai, 2004], [Dielman, 2005]). It contains results for both training and test data.
Now, model-overfitting is the bain of any statistical modeler's existence. We look for results in which model scores for the training and test data sets are similar. If, as often occurs, the model scores for the training data are higher than for test data, overfitting may have occurred. Alternatively, such disparities may represent evidence of heterogeniety in the data.
Two tree-based ensemble methods are highlighted in the table. These achieved the best performance on the test data. In particular, the random-forest regressor provided the best Coefficient of Determination statistics. This achieved an
of 0.870 against the training data. The performance of the bagging-tree regressor was approximately equivalent.
Both methods appear to have yielded near-optimum fits. The scores anfor the training and test data coincide very closely. The other ensemble method, the ada-boosted tree regressor provides performance that is not far behind. None of these methods leads to significant overfitting. These methods appear to have smoothed out the variance. That is the motivation for ensemble methods.

The linear- (Ridge) regression model also performed well. Its score for training data actually exceeds that for the tree-based ensemble methods. Overfitting is however evidenced by a lower
for the test data. A more-optimally-fit model would probably produce balanced
scores similar to those for our tree methods.
Now, the table from [Hastie, et al, 2009, Table 10.1, p. 351] in the Modeling introductory section above leads us to expect good results from Tree-based methods. It also leads to expect strong from the ANN and the kNN models, also. Results from the latter two are less-strong. The ANN is particularly surprising. This merits further investigation.

The figures to the left contain the residual and response plots for test and training estimates produced by the bagging-tree regressor. [Olive, 2017] recommends this visualization. The plots also contain Locally-Weighted Scatterplot Smoothing (LOWESS) curves, also recommended in [Olive, 2017].
First, the LOWESS curves do not perfectly coincide with the red-colored or the
curves. This tells us that the model fails to capture some of the structure in the data. It contains some bias. That our
statistics for test and training are similar, our model appropriately handles the variance.
Secondly, our model underestimates the price of more-expensive properties. Now, square-foot living space is an often-used basis for estimating house price. It is well-known among realtors however that price per square foot falls off for larger properties. Perhaps subsequent analysis will reveal that square footage is accorded too much influence.

Second, the some outliers are occurring. These are evident when for example points are significantly off of the
curve. These instances appear to drive our coefficient of determination
scores.
Now, our second set of response and residual plots depict results for the linear-regression (Ridge) model. This is the default, against which we often compare other results. This model only performs marginally worse. Its outliers — points are significantly off of the
curve — appear however to be marginally more acute.
Our ensemble tree-based models do perform marginally better. The smoothing out of variance through ensembling is evident. This is the motivation for ensembling. That the scores for the ridge model are so close to the tree models seems to indicate that conditional probability is not a substantial driver for this data. The ranges of the bagging-tree and ridge-regressor residual plots, do suggest that the former handles outliers more-effectively.
Finally, many of our models consistently perform better against training data than against test data. Additional analysis is needed to understand other cases. To the extent that the sufficient statistics (e.g., [Cox, 1974]) for the training data are distinct from test data, model-score differences are attributable to heterogeneity. We could compare the two data sets attribute-by-attribute using statistical tests such as the Kolmogorov-Smirnov test to ascertain whether this occurs. That ensembling produces balance between training and test data subsets seems to indicate that heterogeneity is not a substantial problem.
This work is still in a preliminary stage. We demonstrate here the ability to establish a should-cost market price with a reasonable degree of accuracy. The opportunity appears to exist for improvement.
First, our original use case asks for distributions for response-variable estimates as opposed to point estimates we presently get. This allows to assert with an estimated probability that a listed price falls below the market price by a predetermined threshold. Included among the approaches are metalog distribytions by [Keelin, 2016]. Some of the illustrative literature for Multi-Attribute Regression Splines (MARS) demonstrates its use for residual analysis.
Also, we can add additional data to the model. Our protytpical data set spans the period from 2006 to 2010. This of course includes the period including the runup to and aftermath from the late-2000s financial crisis. In general, prices change year-on-year. Things were occurring during that period with a high degree of volatility.
The U.S. Federal Housing Finance Agency publishes a house-price index. This shows trends in housing prices, both upward and downward. Were we to scale our SalePrice response variable to this index, we could better account for this variability.
Other explanatory variables may also instructive. During the 2000s real-estate bubble, Economist magazine periodically published its own house-price index. This model was based on the premise that purchase prices are influenced by rent prices and household incomes within a geographic market. This motivates the incorporation of these attributes into our model. The U.S. Bureau of Labor Statistics publishes these data.
The data dictionary is an operational component of the code. A template was produced using pandas.DataFrame methods. The template was exported to a csv file. This file was manually edited. A "populated" data dictionary was read back into the python environment. The contents of the "notes" and "disposition" columns were then used by the logic to handle and prepare the data for modeling.
| attribute | non_null_records | type | distinct_values | Notes | Disposition | cat_vars |
|---|---|---|---|---|---|---|
| 1stFlrSF | 2051 | int64 | 915 | First Floor square feet. Numeric at integer precision. | Use as provided | Continuous |
| 2ndFlrSF | 2051 | int64 | 504 | Second floor square feet. Numeric at integer precision. | Use as provided | Continuous |
| 3SsnPorch | 2051 | int64 | 22 | Three season porch area in square feet. Numeric. | Use as provided | Continuous |
| Alley | 2051 | object | 3 | Alley access to property. String-categorical. Category “NA” misinterpreted as Null. | Use as provided | Categorical |
| BedroomAbvGr | 2051 | int64 | 8 | Bedrooms above grade (does NOT include basement bedrooms). Discrete numeric. | Use as provided | Discrete |
| BldgType | 2051 | object | 5 | Type of dwelling. Categorical string. | Use as provided | Categorical |
| BsmtCond | 2050 | object | 7 | Evaluates the general condition of the basement. String categorical. NA (⇒ “No Basement”) misinterpreted as NULL; empty values also present. | Assign null values to “NA” | Categorical |
| BsmtExposure | 2047 | object | 6 | Refers to walkout or garden level walls. String categorical. NA (⇒ “No Basement”) misinterpreted as NULL; empty values also present. | Assign null values to “NA” | Categorical |
| BsmtFullBath | 2049 | float64 | 6 | Basement full bathrooms. Discrete numeric count. Missing values ≟ 0. | Assign null values to 0 | Discrete |
| BsmtHalfBath | 2049 | float64 | 5 | Basement half bathrooms. Discrete numeric count. Missing values ≟ 0. | Assign null values to 0 | Discrete |
| BsmtQual | 2050 | object | 7 | Evaluates the height of the basement. String categorical. NA (⇒ “No Basement”) misinterpreted as NULL; empty values also present. | Assign null values to “NA” | Categorical |
| BsmtUnfSF | 2050 | float64 | 968 | Unfinished square feet of basement area. Numeric. | Assign null values to 0 | Continuous |
| BsmtFinSF1 | 2050 | float64 | 822 | Type 1 finished square feet. Numeric. | Assign null values to 0 | Continuous |
| BsmtFinSF2 | 2050 | float64 | 206 | Type 2 finished square feet. Numeric. | Assign null values to 0 | Continuous |
| BsmtFinType1 | 2050 | object | 8 | Rating of basement finished area. String categorical. NA (⇒ “No Basement”) misinterpreted as NULL; empty values also present. | Assign null values to “NA” | Categorical |
| BsmtFinType2 | 2049 | object | 8 | Rating of basement finished area (if multiple types). String categorical. NA (⇒ “No Basement”) misinterpreted as NULL; empty values also present. | Assign null values to “NA” | Categorical |
| CentralAir | 2051 | object | 2 | Central air conditioning. String binary categorical. | Use as provided | Categorical |
| Condition1 | 2051 | object | 9 | Proximity to various conditions, transportation services, in particular. Nine categorical strings. | Use as provided | Categorical |
| Condition2 | 2051 | object | 8 | Proximity to various conditions (if more than one is present). Eight categorical strings. | Use as provided | Categorical |
| Selldate | 2051 | Integer | 55 | Date of sale. Concatenation of Yr_sold, Mo_Sold. | Use as provided | Primary_key |
| Electrical | 2051 | object | 5 | Electrical system. String categorical. | Use as provided | Categorical |
| EnclosedPorch | 2051 | int64 | 159 | Enclosed porch area in square feet. Numeric. | Use as provided | Continuous |
| ExterCond | 2051 | object | 5 | Evaluates the present condition of the material on the exterior. String categorical. | Use as provided | Categorical |
| ExterQual | 2051 | object | 4 | Evaluates the quality of the material on the exterior. String categorical. | Use as provided | Categorical |
| Exterior1st | 2051 | object | 15 | Exterior covering on house. String Categorical. | Use as provided | Categorical |
| Exterior2nd | 2051 | object | 15 | Exterior covering on house (if more than one material). String Categorical. | Use as provided | Categorical |
| Fence | 2051 | object | 5 | Fence quality. String categorical. NA (⇒ “No Fence”) misinterpreted as NULL. | Use as provided | Categorical |
| FireplaceQu | 2051 | object | 6 | Fireplace quality. String categorical. NA (⇒ “No Fireplace”) misinterpreted as NULL. | Use as provided | Categorical |
| Fireplaces | 2051 | int64 | 5 | Number of fireplace. Discrete numeric count. | Use as provided | Discrete |
| Foundation | 2051 | object | 6 | Type of foundation. String categorical. | Use as provided | Categorical |
| FullBath | 2051 | int64 | 5 | Full bathrooms above grade. Discrete numeric count. | Use as provided | Discrete |
| Functional | 2051 | object | 8 | Home functionality (Assume typical unless deductions are warranted). String categorical. | Use as provided | Categorical |
| GarageArea | 2050 | float64 | 515 | Size of garage in square feet. Continuous numeric at integer precision. Empty for Garage_Type = “NA”. | Assign null values to 0 | Continuous |
| GarageCars | 2050 | float64 | 7 | Size of garage in car capacity. Discrete numeric count. Missing values ≟ 0. | Use as provided | Discrete |
| GarageCond | 2050 | object | 7 | Garage condition. String categorical. NA (⇒ “No Garage”) misinterpreted as NULL; Missing value for non-NA garage. | Discard records: null-valued for non-NA garage | Categorical |
| GarageFinish | 2050 | object | 5 | Interior finish of the garage. String categorical. NA (⇒ “No Garage”) misinterpreted as NULL. | Use as provided | Categorical |
| GarageQual | 2050 | object | 7 | Garage quality. String categorical. NA (⇒ “No Garage”) misinterpreted as NULL; Missing value for non-NA garage. | Discard records: null-valued records for non-NA garage | Categorical |
| GarageType | 2051 | object | 7 | Garage location. String categorical. NA (⇒ “No Garage”) misinterpreted as NULL. | Use as provided | Categorical |
| GarageYrBlt | 1937 | float64 | 214 | Year garage was built. Numeric at discrete-year resolution. Empty for Garage_Type = “NA”. | Discard attribute. Highly correlated with Year_built attribute. | Discrete |
| GrLivArea | 2051 | int64 | 1053 | Above grade (ground) living area square feet. Numeric at integer precision. | Use as provided | Continuous |
| HalfBath | 2051 | int64 | 3 | Half baths above grade. Discrete numeric count. | Use as provided | Discrete |
| Heating | 2051 | object | 5 | Type of heating. String categorical. | Use as provided | Categorical |
| HeatingQC | 2051 | object | 5 | Type of heating. String categorical. | Use as provided | Categorical |
| HouseStyle | 2051 | object | 8 | Style of dwelling. Categorical string | Use as provided | Categorical |
| Id | 2051 | int64 | 2051 | Unique ID. Integer | Use as provided | Primary_key |
| KitchenAbvGr | 2051 | int64 | 4 | Kitchens above grade. Discrete numeric count. | Use as provided | Discrete |
| KitchenQual | 2051 | object | 4 | Kitchen quality. String categorical. | Use as provided | Categorical |
| LandContour | 2051 | object | 4 | Flatness of the property. Four string Categorical | Use as provided | Categorical |
| LandSlope | 2051 | object | 3 | Slope of property. Three categorical strings. | Use as provided | Categorical |
| LotArea | 2051 | int64 | 1476 | Lot size in square feet. Numeric continuous at integer precision. | Use as provided | Continuous |
| LotConfig | 2051 | object | 5 | Lot configuration. Five string categorical. | Use as provided | Categorical |
| LotFrontage | 1721 | float64 | 448 | Linear feet of street connected to property. Numeric continuous No obvious relationship to other attributes. | Discard attribute. | Continuous |
| LotShape | 2051 | object | 4 | General shape of property. Four string Categorical. | Use as provided | Categorical |
| LowQualFinSF | 2051 | int64 | 31 | Low quality finished square feet (all floors). Numeric at integer precision. | Use as provided | Continuous |
| MasVnrArea | 2029 | float64 | 395 | Masonry veneer area in square feet. Some empty values. Numeric continuous. Empty ≟ 0. | Discard records: null-valued records. | Continuous |
| MasVnrType | 2029 | object | 5 | Masonry veneer type. Five categorical values. Some empty values. Empty ≟ “None” | Discard records: null-valued records. | Categorical |
| MiscFeature | 2051 | object | 6 | Miscellaneous feature not covered in other categories. String categorical. NA (⇒ “None”) misinterpreted as NULL. | Use as provided | Categorical |
| MiscVal | 2051 | int64 | 28 | Value of miscellaneous feature. Numeric. | Use as provided | Continuous |
| MSSubClass | 2051 | int64 | 16 | Identifies the type of dwelling involved in the sale. Numeric categorical (non-ordinal). Sixteen categories, all of which represented in data. | Use as provided | Categorical |
| MSZoning | 2051 | object | 7 | Identifies the general zoning classification of the sale. String categorical. Seven of eight possible values represented. | Use as provided | Categorical |
| Neighborhood | 2051 | object | 28 | Physical locations within Ames city limits. 28 categorical strings. | Use as provided | Categorical |
| OpenPorchSF | 2051 | int64 | 223 | Open porch area in square feet. Numeric. | Use as provided | Continuous |
| OverallCond | 2051 | int64 | 9 | Rates the overall condition of the house. Categorical Integer. | Use as provided | Categorical |
| OverallQual | 2051 | int64 | 10 | Rates the overall material and finish of the house. Categorical Integer. | Use as provided | Categorical |
| PavedDrive | 2051 | object | 3 | Paved driveway. String categorical. | Use as provided | Categorical |
| PID | 2051 | int64 | 2051 | Unique ID. Integer. | Use as provided | Primary_key |
| PoolArea | 2051 | int64 | 10 | Pool area in square feet. Numeric. | Use as provided | Continuous |
| PoolQC | 2051 | object | 5 | Pool quality. String categorical. NA (⇒ “No Pool”) misinterpreted as NULL; Missing value for non-NA garage. | Use as provided | Categorical |
| RoofMatl | 2051 | object | 6 | Roof material. String Categorical. | Use as provided | Categorical |
| RoofStyle | 2051 | object | 6 | Type of roof. String Categorical. | Use as provided | Categorical |
| SalePrice | 2051 | object | 9 | Type of sale. String categorical. | Use as provided | Categorical |
| SaleType | 2051 | int64 | 828 | Type of sale. Target Variable. | Use as provided | |
| ScreenPorch | 2051 | int64 | 100 | Screen porch area in square feet. Numeric. | Use as provided | Continuous |
| Street | 2051 | object | 2 | Type of road access to property. Two-string categorical | Use as provided | Categorical |
| TotalBsmtSF | 2050 | float64 | 893 | Total square feet of basement area. Numeric | Assign null values to 0 | Continuous |
| TotRmsAbvGrd | 2051 | int64 | 14 | Total rooms above grade (does not include bathrooms). Discrete numeric count. | Use as provided | Discrete |
| Utilities | 2051 | object | 3 | Type of utilities available. Four string categorical, of which three are present. No 'ELO' isntances | Use as provided | Categorical |
| WoodDeckSF | 2051 | int64 | 322 | Wood deck area in square feet. Numeric. | Use as provided | Continuous |
| YearBuilt | 2051 | int64 | 113 | Original construction date. Numeric measurement at integer precision. | Use as provided | Continuous |
| YearRemodAdd | 2051 | int64 | 61 | Remodel date (same as construction date if no remodeling or additions). Numeric measurement at integer precision. | Use as provided | Continuous |