- Cluster with Minibatch Kmeans
- Sub-cluster with DBSCAN
- Write data to PSQL/PostGIS database
- Import county shapefile and census population data
- Query tweets per capita for each county
Figure 1: Geo-tagged tweets in bay area (color per cluster)
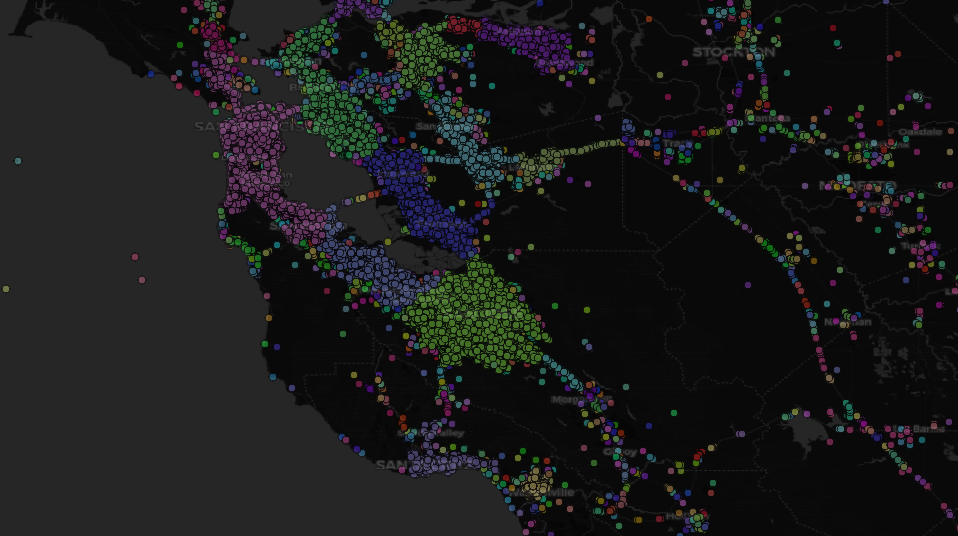
Figure 2: Final cluster boundaries after running DBSCAN

Figure 3: Chloropleth indicating tweets per capita for each county

For clustering, a hierarchical approach was used to overcome memory limitations. One million datapoints is too much for DBSCAN, so first minibatch Kmeans was used to quickly breakdown data into a minimal amount of cluster groups. The minibatch Kmeans cluster method uses a pre-determined number of clusters and iteratively sets a centroid until it converging into equal density clusters. Alternatively, the DBSCAN cluster method uses a stipulated distance (epsilon) to connect datapoints and establish clusters. Clusters containing less than 1,000 tweets were considered insignificant and eliminated.