Can plotnine make a matrix of scatterplots? #16
Comments
|
You cannot do that with plotnine, though it is a goal of the project that a third party library should be able to implement such compound plots using plotnine. However, you can do it with seaborn. |
|
Sorry for reviving this post Is this answer still valid in 2021? |
|
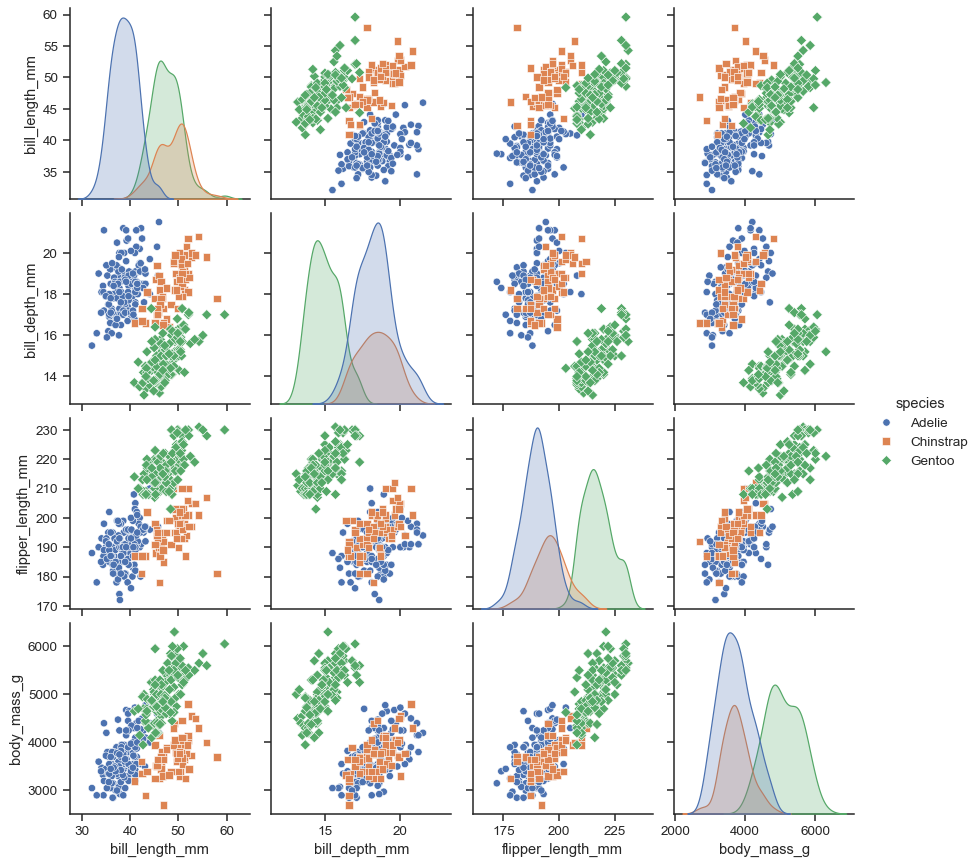
Still nothing 'out of the box' I believe. Here's a start though:
|

|
I was annoyed that the seaborn implementation of a pairplot did not allow me to change the shape of the point, only the color. This implementation in plotnine can do both shape and color. Note that I use
|

|
@has2k1 Is there a third-party plotnine package where this function be sent to? |
It looks like with seaborn you can change the markers in pairplot:
|
|
@PaulHiemstra, I don't think there is. Please open a separate issue to track this. |
The issue here is that the colors and the markers are based on the same variable, this is not what I was looking for. I want to base the color on one variable, and shape on the other. the case of my visualisation this enables me to inspect the difference between the fitted clusters of a Kmeans and the underlying Species of Iris. |
I'll do that. |
Something similar to R's
pairsorplotmatrixfunctions; see e.g. here?The text was updated successfully, but these errors were encountered: