Customer churn refers to when a customer (player, subscriber, user, etc.) ceases his or her relationship with a company. Businesses typically treat a customer as churned once a particular amount of time has elapsed since the customer’s last interaction with the site or service. The full cost of customer churn includes both lost revenue and the marketing costs involved with replacing those customers with new ones. Reduction customer churn is important because cost of acquiring a new customer is higher than retaining an existing one. Reducing customer churn is a key business goal of every business. This case is related to telecom industry where particular organizations want to know that for given certain parameters whether a person will churn or not.
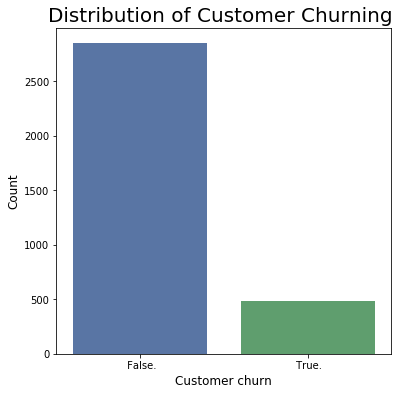
Our target variable has two categories which include True and False values.
True = Customer will move or churn out.
False = Customer won’t move
We can clearly see that our data is highly imbalanced. The occurrence of false
is higher than True. There are 2850 (85.51% ) customers who churn out and 483 (14.49%)
customers retained.

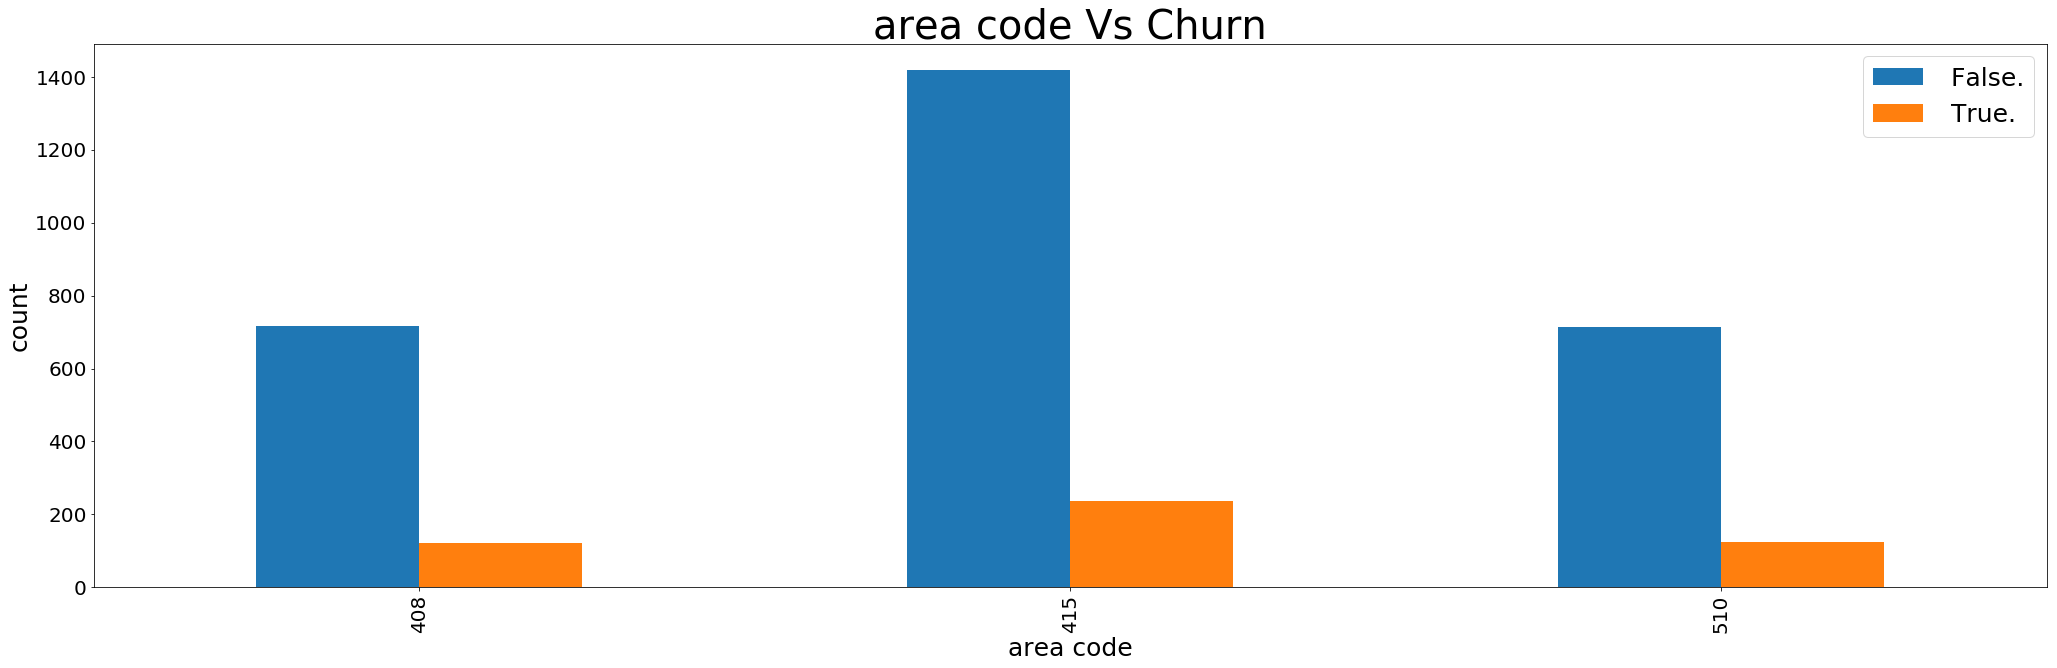
Most of the churned customers are from 415 area.
Churn rate is more with customer using international plan. As only 323 customer
using International plan and 137 churning out of them.

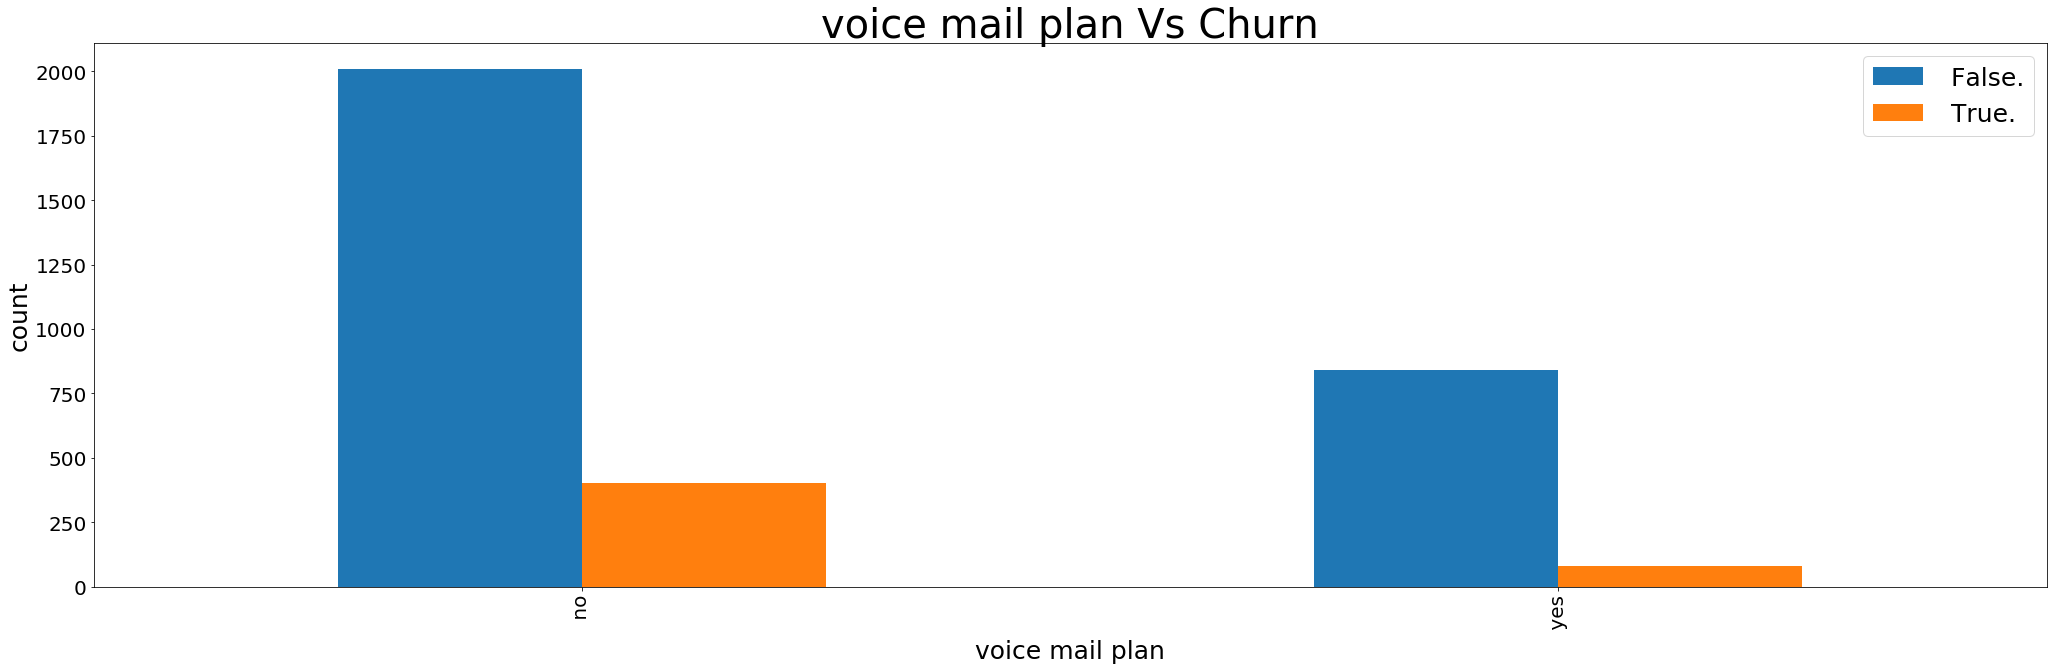
922 customer using voice mail plan and 80 out of them are churning
Churn rate for Customer neither having voicemail plan nor international plan is
9.06%. Churning rate for customer having International plan but don’t have voicemail plan is
3.03% out of 6.93% customers. Churning of customer having both voicemail plan & international plan is 1.08% out of
2.76%
‘Total day minutes’ and ‘total day charges’ are highly correlated
‘Total eve minutes’ and ‘total eve charges’ are highly correlated
‘Total night minutes’ and ‘total night charges’ are highly correlated
‘Total intl minutes’ and ‘total intl charges’ are highly correlated

Most of thevariables are normally distributed.

SMOTE synthesize new minority instances between existing real minority instances. Imagine that SMOTE Draw lines between existing minority instances. SMOTE then imagine new synthetic minority instance somewhere on that lines. Like it will generate the synthetics of two real minority cases or data points. Applying synthetic minority oversampling technique to overcome the challenge of imbalance dataset as having an imbalance dataset will have negative impact over machine learning model predictions. In python we use SMOTE
False = 1895 True = 338
False = 1895 True = 1895
IN R we have used ROSE sampling technique. Which is similar to SMOTE, It also generating the synthetic data points and also it will under sample some random points from majority class.
False = 1881 True = 319
False = 1101 True = 1019
- Random Forest
- Logistic Regression
- K- Nearest Neighbors
- Naïve Bayes
Random forest has the best results for our problem. Random Forest has the best accuracy and lowest false negative rate and also lowest false positive rate.Hence we’ll choose Random Forest.
