Chrome Developer Tools is a comprehensive toolkit for developers, built directly into the Chrome browser. These tools let you view and edit web pages in real time and diagnose problems more quickly.
For this tutorial we'll start with the following page in the browser: internetingishard.com.
You can open Developer Tools with keyboard shortcuts or through the Chrome menu.
The keyboard shortcuts are:
- Mac OS: CMD+Shift+J or CMD+Shift+C
- Linux, Chromebook and Windows: Ctrl+Shift+J
From the Chrome menu:
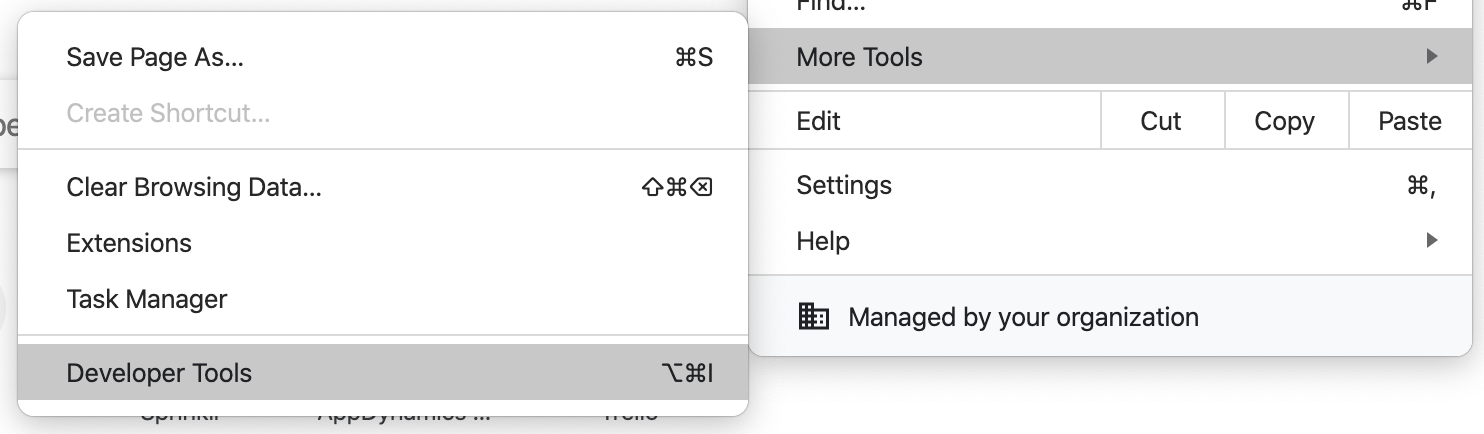
Open the Chrome menu and go to “More Tools” > “Developer Tools.”
From the Context Menu:
You can right-click (Windows) or Ctrl-click (Mac) anything on a web page and select “Inspect Element” to open Developer Tools.
The Developer Tools panel will open in whatever web page you’re on. You need to open them again for each new Chrome window, but you can navigate between web pages with them open.
The first item to be aware of is where you want the Chrome Developer Tools to be "docked" in relation to your browser window. You can adjust this setting by clicking on the ellipsis in the upper right corner and selecting the desired dock-side. I tend to like the tools to be docked on the bottom so that my screen width is not modified.

There are multiple tabs contained within the Tools window. The ones that we will focus on in this lesson are:
- Elements
- Console
- Source
- Network
They don’t always stay in this order—Chrome moves them around based on which you opened last. By default, Developer Tools opens with the Elements tab open.
Shows you the HTML used to build the page you’re looking at.

You can select a specific element on the page to be active in the Elements tab by following the steps below.

When an element is selected, the styles for that element are displayed in the Styles pane on the right.

Deals with JavaScript. It gives you information about interactive elements on a page. In Console, you can write JavaScript to interact with the web page you’re viewing, and you can also write JavaScript code to log information to the Console to help in debugging.
Lists all the files that were used to make the website are stored and lets you inspect them.
Shows details for all the files that are loaded for the document you’re looking at.
This exercise walks you through using the Network View, to see the details of request/response communication that goes on when a web page is loaded.
When you enter an URL (Uniform Resource Locator) into the browser search input box, a lot of communication is going on behind the scenes between the web browser and the web server to retrieve the collection of files that are necessary to fully display the web page. There is the top-level HTML page, but also stylesheets, JavaScript files, fonts, images, videos, and more.
After the web browser receives the response for the initial HTML page, it will read through and sequentially request any files required that it encounters within the HTML markup.
- Click on the Network Tab
- Refresh the page to force it to reload and repopulate the Network Tab
You can see the first network request was for the URL www.internetingishard.com.

Click on the item in the list. The Header Panel will become active to the right. This give more information about the request. All of this information is included in the request sent to the web server.
The Remote Address is the IP Address that it has resolved through DNS for the server.

Click on the Response tab on the right. This displays what is returned to the web browser by the web server processing the request. It is the HTML document that is the default document for the internetingishard.com site (a specific document name was not specified in the URL).
As you can see in HTML, there are a bunch of link elements that are specifying images and stylesheet files that need to be requested to complete the loading of this web page. As the web browser reads through the HTML document, and encounters these link elements, it will made additional requests to the web server for these files.
You can see this by looking at the connection between the item outlined on the right and the corresponding request on the left.

Clicking on the stylesheet file on the left, brings up the corresponding data that is returned from the request for that file.

As you can see with this relatively simple website, there is a lot going on to load the page.
Let's try one more example to see how much network activity is going on behind the scenes.
Click on the URL: google.com
Open the Chrome Developer Tools and click on the Network Tab.
Click the Clear button to clear all of the network activity so we can focus on activity after the page has loaded.

Start typing the word "Chrom" into the search box and watch the network activity as you do that. The web page is communicating with Google's web server continually behind the scenes to retrieve potential search terms to suggest.
Each letter you type triggers a new request to the server, supplying the latest search string, and the response includes a list of possible completions to provide to the user.
Load the index.html file in the project folder
- Right-click on the file in the VS Code File Explorer and select the Open with Live Server option. This will load the file in the browser.
- Open the Chrome Developer Tools and make sure the Elements tab is active.
- Use the element selector tool to select the Orange Jelly
<h2>element.


On the right, the CSS styles are displayed for the active element. Click on the value for the #orange-jelly selector and enter a named color, such as purple. Notice that the HTML displayed updates to reflect the new color value.
Refresh the screen and notice that the color reverts back to what was originally defined in the CSS.
In the Elements view, selec the <ul> element just under the <h1>Meet the Jelloes<h1> heading.
Look on the right in the Styles tab and scroll down until you see the box-model display that shows the margin, border and padding for the selected item.
Move your mouse over the different sections of the box and observe that it displays highlighting in the HTML document that corresponds to the area you are hovering over.
Open the file questions.txt in the project folder and answer each question on the line following the question.
Your project now contains a modified questions.txt file. Turn in your assignment by following the ACP git commands.