These Panel applications demonstrate what you can build with Panel and how to do it. Click on each thumbnail to see the app running live, and click on "See source" to look at how each of the components are configured and put together. The source is fully runnable in your browser thanks to WASM & Pyodide; just press the ▶ button on the first code cell to run all the cells.
::::{grid} 1 2 2 3 :gutter: 1 1 1 2
:::{grid-item-card} Portfolio Optimizer
:target: https://|gallery-endpoint|.holoviz.dsp.anaconda.com/portfolio_optimizer
:width: 100%
Stock portfolio optimization by exploring the efficient frontier and optimizing the Sharpe ratio. +++ See source :::
:::{grid-item-card} Streaming Videostream
:target: https://|gallery-endpoint|.holoviz.dsp.anaconda.com/streaming_videostream
:width: 100%
Applying face detection and other image transforms on your webcam input using scikit-image. +++ See source :::
:::{grid-item-card} Windturbines Explorer
:target: https://|gallery-endpoint|.holoviz.dsp.anaconda.com/windturbines
:width: 100%
Visually explore a dataset of US Windturbines. +++ See source :::
:::{grid-item-card} Portfolio Analyzer
:target: https://|gallery-endpoint|.holoviz.dsp.anaconda.com/portfolio_analyzer
:width: 100%
Analyze a stock portfolio using Plotly and Tabulator components. +++ See source :::
:::{grid-item-card} OGGM Glaciers
:target: https://|gallery-endpoint|.holoviz.dsp.anaconda.com/glaciers
:width: 100%
Visually explore the worlds glaciers in this application built in collaboration with OGGM. +++ See source :::
:::{grid-item-card} VTK Slicer
:target: https://|gallery-endpoint|.holoviz.dsp.anaconda.com/vtk_slicer
:width: 100%
Visualizing MRI brain scans and their cross-sections using a VTK volume and linked 2D slices. +++ See source :::
:::{grid-item-card} Deck.GL: NYC Taxi
:target: https://|gallery-endpoint|.holoviz.dsp.anaconda.com/nyc_deckgl
:width: 100%
NYC Taxi trips visualized and animated using Deck.GL. +++ See source :::
:::{grid-item-card} Gapminders
:target: https://|gallery-endpoint|.holoviz.dsp.anaconda.com/gapminders
:width: 100%
Visualizing the Gapminders data using the most common Python plotting libraries. +++ See source :::
:::{grid-item-card} VTK: St. Helens
:target: https://|gallery-endpoint|.holoviz.dsp.anaconda.com/vtk_interactive
:width: 100%
Visualizing the surface of Mount St. Helens using VTK and linked widgets to control the rendering. +++ See source :::
:::{grid-item-card} Penguin Crossfiltering
:target: https://|gallery-endpoint|.holoviz.dsp.anaconda.com/penguin_crossfilter
:width: 100%
Palmer Penguins data visualized using a set of linked cross-filtering plots. +++ See source :::
:::{grid-item-card} Deck.GL: Game of Life
:target: https://|gallery-endpoint|.holoviz.dsp.anaconda.com/deckgl_game_of_life
:width: 100%
Game of Life simulation rendered on a 3D plane using Deck.gl. +++ See source :::
:::{grid-item-card} hvPlot Explorer
:target: https://|gallery-endpoint|.holoviz.dsp.anaconda.com/hvplot_explorer
:width: 100%
Use the hvPlot explorer to interactive visualize your dataset. +++ See source :::
:::{grid-item-card} Iris KMeans Clustering
:target: https://|gallery-endpoint|.holoviz.dsp.anaconda.com/iris_kmeans
:width: 100%
Interactively apply KMeans clustering on the Iris dataset. +++ See source :::
:::{grid-item-card} XGBoost Classifier
:target: https://|gallery-endpoint|.holoviz.dsp.anaconda.com/xgboost_classifier
:width: 100%
Interactively apply a XGBoost classifier on the Iris dataset. +++ See source :::
:::{grid-item-card} Altair Brushing
:target: https://|gallery-endpoint|.holoviz.dsp.anaconda.com/altair_brushing
:width: 100%
Try interactive brushing on an Altair plot linked with a table. +++ See source :::
::::
Examples of Panel applications maintained by the HoloViz project.
::::{grid} 1 2 2 3 :gutter: 1 1 1 2
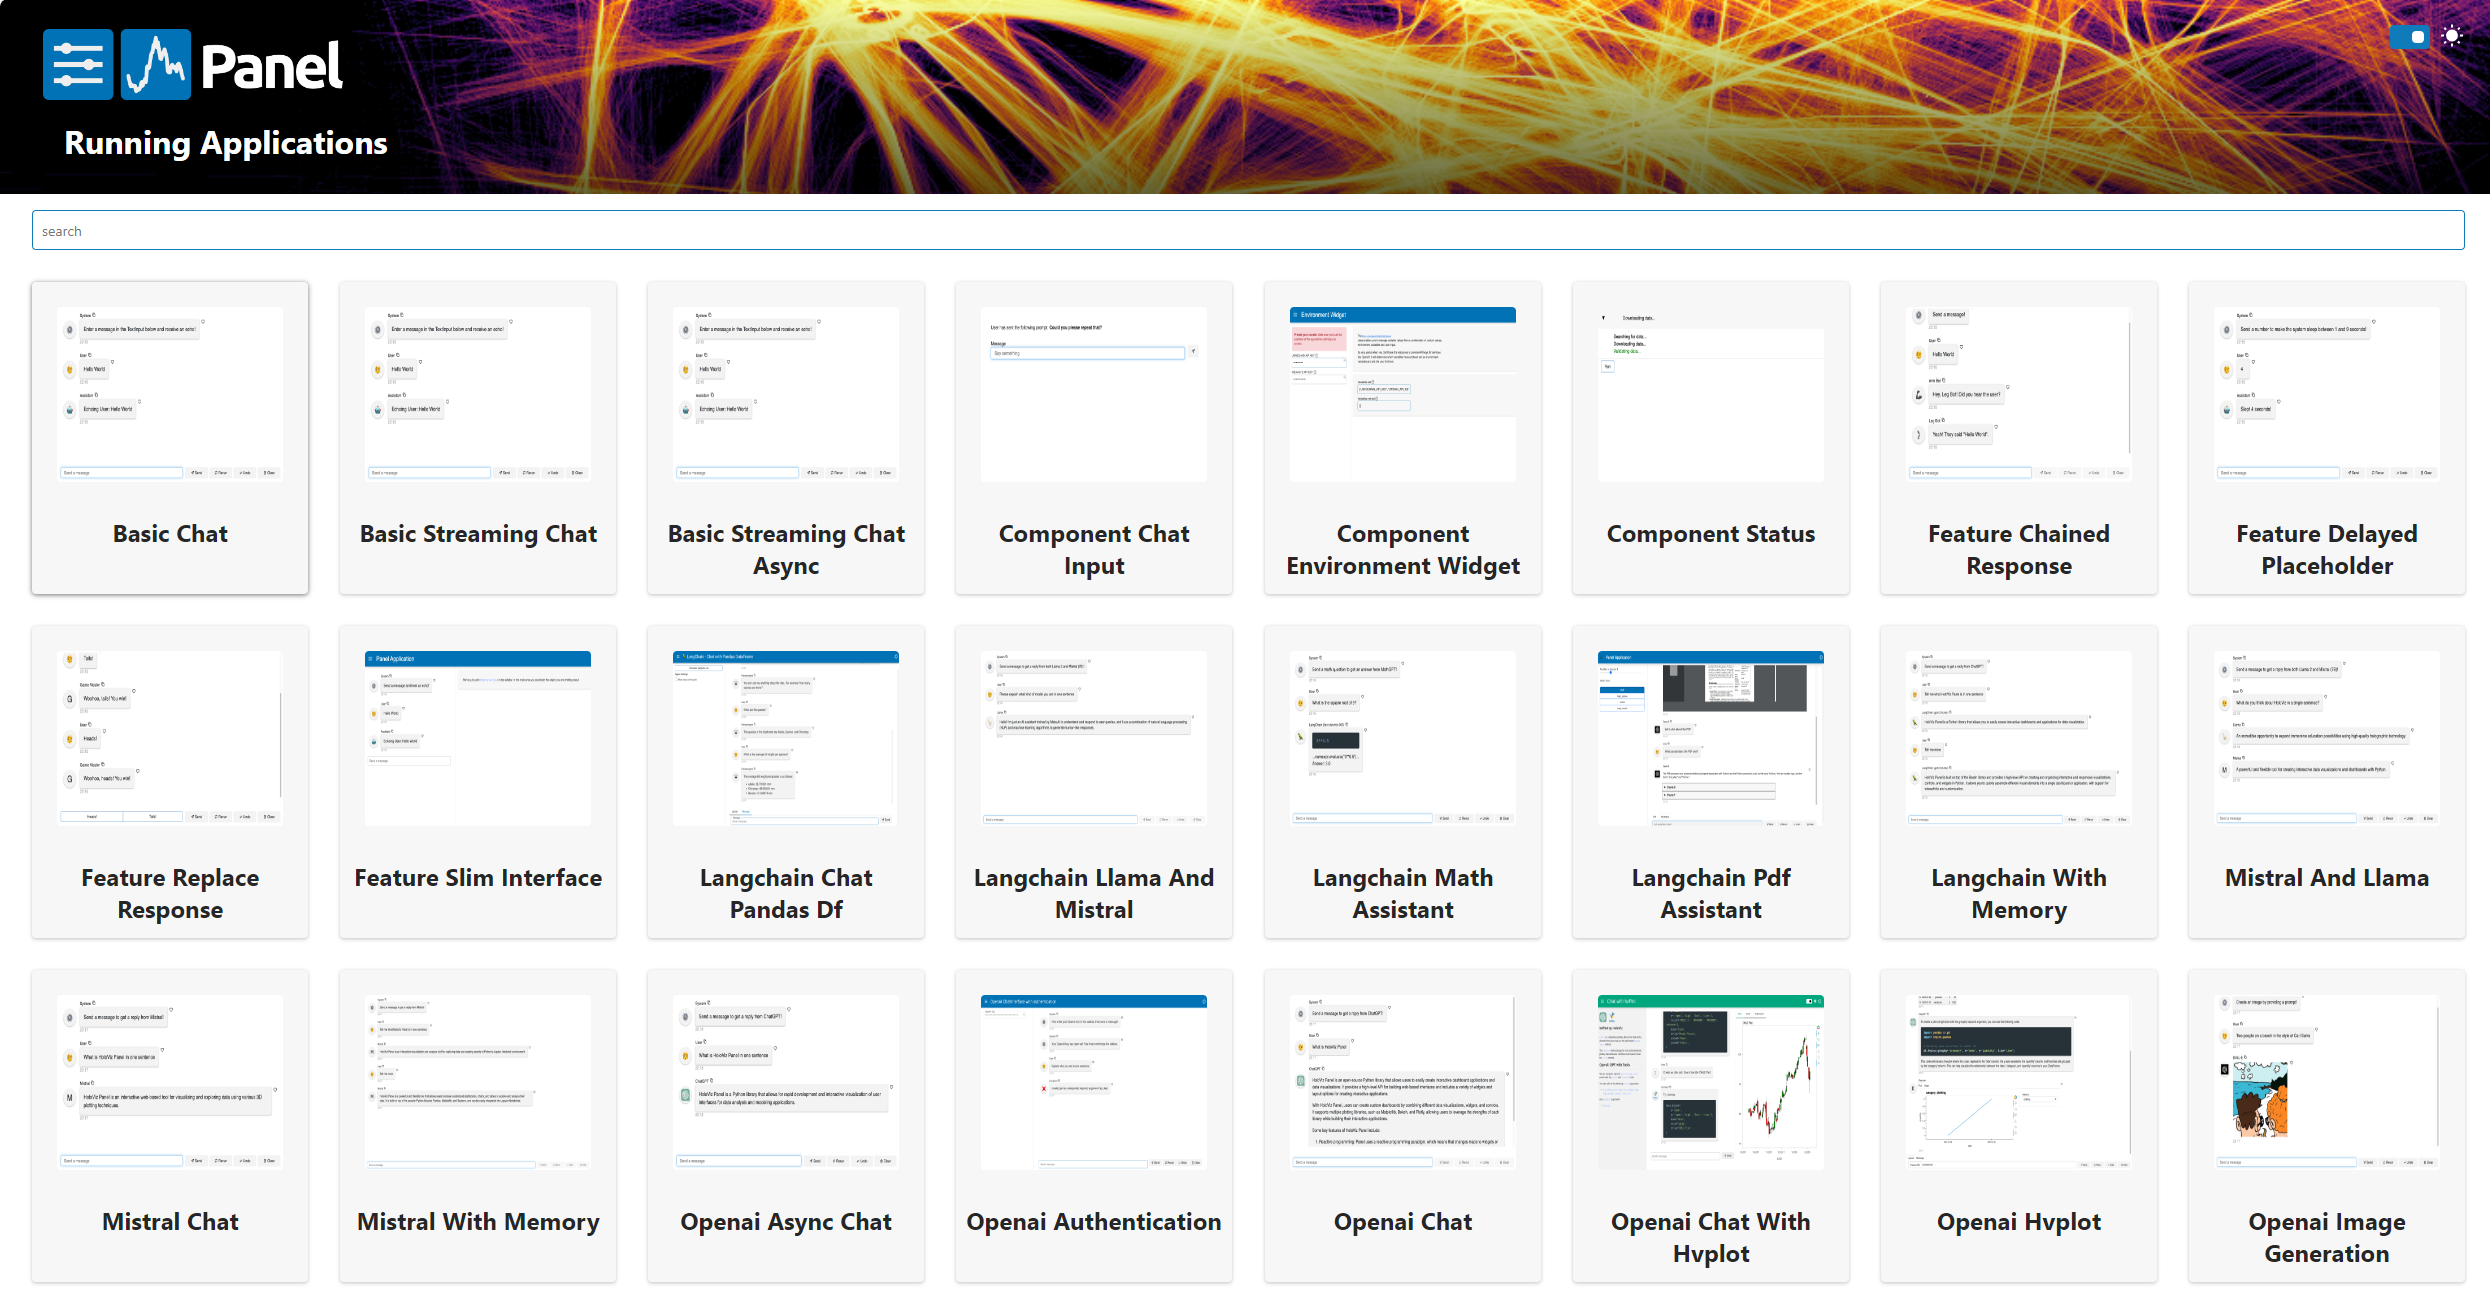
:::{grid-item-card} Panel Chat Examples :img-top: https://assets.holoviz.org/panel/gallery/panel_chat_examples.png 🔗 https://holoviz-topics.github.io/panel-chat-examples/ :link-type: url
A large selection of chat applications showcasing Panels chat components. :::
::::
::::{grid} 1 2 2 3 :gutter: 1 1 1 2
:::{grid-item-card} awesome-panel.org :img-top: https://assets.holoviz.org/panel/gallery/community/awesome-panel.png 🔗 https://awesome-panel.org :link-type: url
A great selection of applications and other resources showcasing various features of Panel. :::
:::{grid-item-card} Panel Chat Examples :img-top: https://raw.githubusercontent.com/holoviz-topics/panel-chat-examples/main/assets/images/panel-chat-examples-index-page.png 🔗 https://holoviz-topics.github.io/panel-chat-examples/ :link-type: url
Examples using Panel and its Chat Components; Panels chat components are multi modal and supports LangChain, OpenAI, Mistral, Llama, etc. :::
:::{grid-item-card} cuxfilter :img-top: https://assets.holoviz.org/panel/gallery/community/cuxfilter.png 🔗 https://github.com/rapidsai/cuxfilter :link-type: url
cuxfilter ( ku-cross-filter ) is a RAPIDS framework to connect web visualizations to GPU accelerated crossfiltering which is built on top of Panel. :::
:::{grid-item-card} AstronomicalAL :img-top: https://assets.holoviz.org/panel/gallery/community/AstronomicAL.png 🔗 https://github.com/grant-m-s/AstronomicAL :link-type: url
An interactive dashboard for visualisation, integration and classification of data using Active Learning. :::
:::{grid-item-card} PyHDX :img-top: https://assets.holoviz.org/panel/gallery/community/pyhdx.png 🔗 https://github.com/Jhsmit/PyHDX :link-type: url
PyHDX is software to extract H/D exchange kinetics from HDX-MS data sets in terms of Gibbs free energy of exchange (ΔG) at the residue level. :::
:::{grid-item-card} gluoNNet Aviation Tracking :img-top: https://assets.holoviz.org/panel/gallery/community/gluoNNet.png 🔗 http://gluonnet.com/portfolio/aviation-graphs/ :link-type: url
The gluoNNet aviation tracking application visualizes airplane positioning (ADS-B) data to track, analyse, and manage flight tracks, aircraft behaviour, and flight efficiency. :::
::::
:titlesonly:
:hidden:
:maxdepth: 1

altair_brushing
deckgl_game_of_life
gapminders
glaciers
hvplot_explorer
iris_kmeans
nyc_deckgl
penguin_crossfilter
penguin_kmeans
portfolio_analyzer
portfolio_optimizer
streaming_videostream
vtk_interactive
vtk_slicer
vtk_warp
windturbines
xgboost_classifier