COSMOS Web - a web application to visualize telemetry data from a satellite using Grafana.

We recommend installing COSMOS via Docker. Refer to the instructions on the main cosmos repository: https://github.com/hsfl/cosmos to get started (if you have not done it yet)
Running the COSMOS Web Docker Containers
The following guide assumes that steps 1-3 of the Install Instructions (via Docker) were successfully completed on the COSMOS Readme page.
- Change directories to the root of the cosmos-docker folder:
In a terminal window (Linux/MacOS) or WSL window (Windows), change directories to the root of your cosmos installation:
cd ~/cosmos-docker- Initialize git submodules:
Then run the following command to initialize the git submodules of the cosmos repository, which will pull COSMOS Web and the grafana plugins:
git submodule update --init --recursive- Modify cosmos .env file
We will need to modify two .env files to configure the COSMOS Web setup. Let's start with the .env in the root folder of cosmos-docker that we created in step 2 from the previous COSMOS Installation guide. Open the .env file at ~/cosmos-docker/.env with your preferred text editor (you can also open the entire cosmos-docker folder in VSCode).
The bottom half of the file has several lines commented out, with only this line uncommented:
# Run only COSMOS Core
COMPOSE_FILE=./docker-compose.yml
The COMPOSE_FILE environment variable is where we specify which Docker Compose configuration files to use when running docker compose commands. To run COSMOS Web, we will want to uncomment either this COMPOSE_FILE line:
# Cosmos-Web release ver:
COMPOSE_FILE=./docker-compose.yml:$COSMOSWEBDIR/docker-compose.yml
or this COMPOSE_FILE line, if you are using a Mac computer with the new ARM chips:
# Cosmos-Web release ver for Mac users with the new ARM chip:
COMPOSE_FILE=./docker-compose.yml:$COSMOSWEBDIR/docker-compose.yml:$COSMOSWEBDIR/docker-compose-mac-m2.yml
After uncommenting out the appropriate line for your use, save the file and proceed.
- Modify cosmos-web .env file
Make a copy of the .env.example file in tools/cosmos-web and rename it to .env. Do this either in the file explorer, an IDE, or if using the terminal, use this command:
cp tools/cosmos-web/.env.example tools/cosmos-web/.envThen open up the newly copied tools/cosmos-web/.env file in your preferred text editor. Replace the default usernames and passwords with your preferred choice of login credentials.
Example:
...
DOCKER_INFLUXDB_INIT_ORG=myorganization (you may also change this variable, which is by default set to 'hsfl')
DOCKER_INFLUXDB_INIT_ADMIN_TOKEN=mycustominfluxdbtoken (you may also change this variable)
...
GF_SECURITY_ADMIN_USER=myusername
GF_SECURITY_ADMIN_PASSWORD=mypassword
...
etc.
- Run COSMOS Web Containers
Start up the COSMOS Web containers with the following command:
docker compose up -dAnd that's it!
THIS SECTION IS OUTDATED AND NEEDS TO BE UPDATED. THE GENERAL SETUP TO GET GRAFANA PANELS, DASHBOARDS, AND DATASOURCES ADDED AND DISPLAY ARE STILL VALID, BUT THE FINAL PLUGINS WILL LIKELY NOT WORK UNTIL FIXED
Now that both COSMOS Web and the Grafana plugins are installed, we can create a dashboard in Grafana to display some data.
If your COSMOS docker containers are not running, return to the instructions on the main COSMOS repository for help. You can check to see if they are running with:
docker ps
With your Grafana container running, go to http://localhost:3000 in your browser and log in with the username and password you specified in the .env file under GF_ADMIN_USER and GF_ADMIN_PASSWORD.
After successfully logging in, look for a gear icon on the left side navigation bar and click on Data sources.
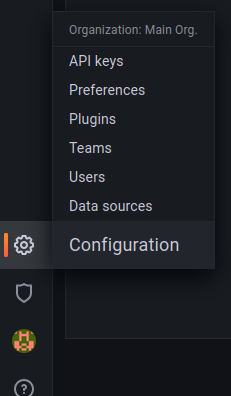
In the Data sources tab of the Configuration page that shows up, search for InfluxDB and click on the InfluxDB data source option that shows up.

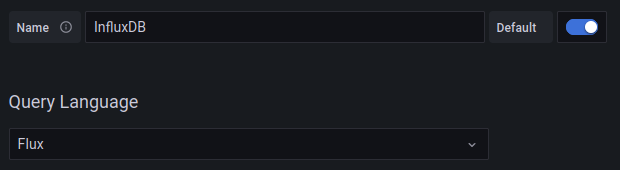
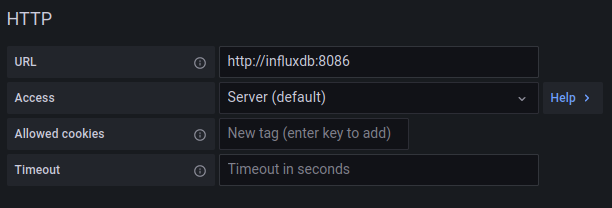
You will be asked to configure the InfluxDB data source. First change the Query Language from InfluxQL to Flux. Then under the HTTP section, enter http://influxdb:8086 into the URL input. The other options in the HTTP section can stay their defaults.
In the Auth section, enter in the username and password you specified in the .env file under INFLUXDB_INIT_ADMIN_USERNAME and INFLUXDB_INIT_ADMIN_PASSWORD. The other options can stay their defaults.

In the final section, InfluxDB Details, enter in for Organization and Token the values you specified in the .env file under INFLUXDB_INIT_ORG and INFLUXDB_INIT_ADMIN_TOKEN, respectively. In the Default Bucket input, enter Simulator_Data, as this is the bucket that simulated data will be sent to. The other options can stay their defaults.

Click on Save & Test.
While any plugins in the grafana-plugin folders should be installed by default, you can also add them manually in the Plugins tab in the Configuration page. The Configuration page you access in the same way as the Data sources tab, by clicking on the gear in the navigation bar on the left side of the screen. If you do not see the Grafana plugins downloaded earlier in this guide, try to restart the Grafana container again with
docker restart cosmos_grafana
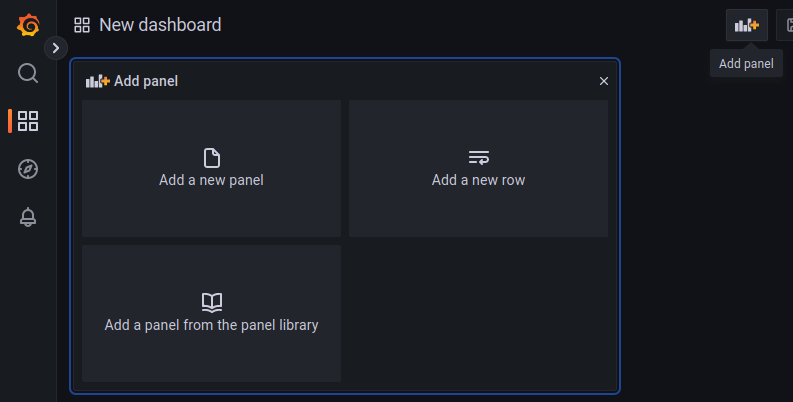
In the navigation bar on the left side, hover over the Dashboards icon, which looks like four squares, and click on New Dashboard.

You will be taken to a new dashboard page with a panel creator in the layout for you. If you wish to add more panels in the future, you can add a panel creator to the layout by clicking on the Add Panel button in the top bar. Click on Add a new panel.
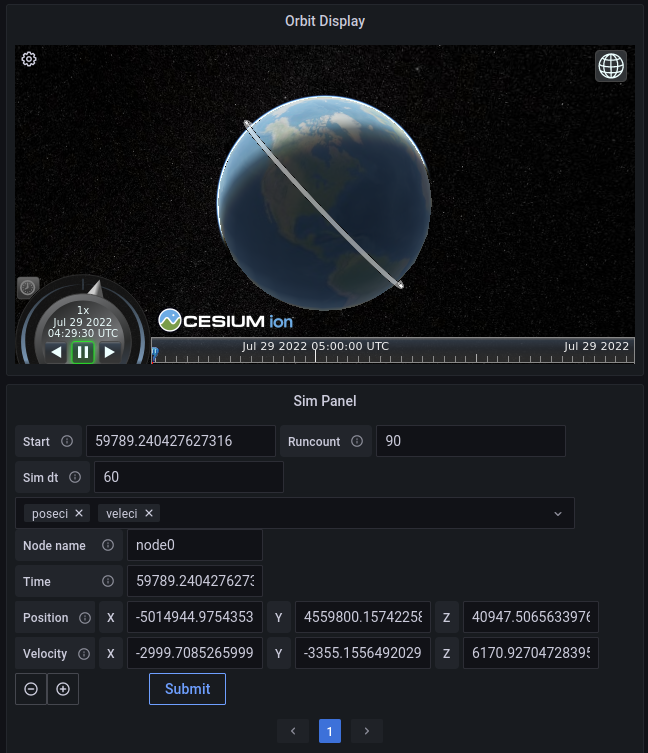
You can change the type of visualization that the panel will use on the upper right drop-down menu which is initially Time series. Click on the dropdown and select Orbit Display.


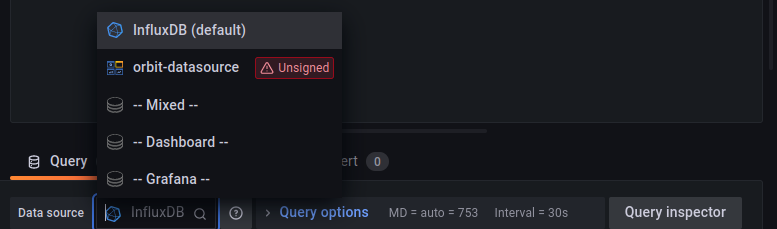
You can select the datasource that the visualization will fetch its data from on the below the visualization panel. In the Data sources dropdown, select orbit-datasource. If it does not show up by default, see that the zip plugin was correctly placed and unzipped, the Grafana container was restarted, and you may have to add it in the Data sources configurations similarly to how you added the InfluxDB data source.
In the Name input of the orbit-datasource, enter node0.

Similarly, add the Cosmos Simulator panel.
In the Data source select 'InfluxDB'. Then click "Save" and "Apply"

The Cosmos Simulator plugin allows you to create some simulated orbital data for a number of numbers. The default values will generate an orbit for a number of satellites in a trailing formation. Click Submit to send the request, which will populate the database with data. The Orbital Display panel will then visualize this data. You can click on the refresh button on the top right of the screen to have all panels in the dashboard resend their queries. The Orbital Display panel should then display a nice orbit to view.