Skip to content
New issue

Have a question about this project? Sign up for a free GitHub account to open an issue and contact its maintainers and the community.

By clicking “Sign up for GitHub”, you agree to our terms of service and privacy statement. We’ll occasionally send you account related emails.

Already on GitHub? Sign in to your account

Add plot display range #2958

Open
wants to merge 6 commits into
base: RELEASE_next_patch
Choose a base branch
from

Conversation

ericpre
Copy link
Member

@ericpre ericpre commented Jun 15, 2022

Description of the change

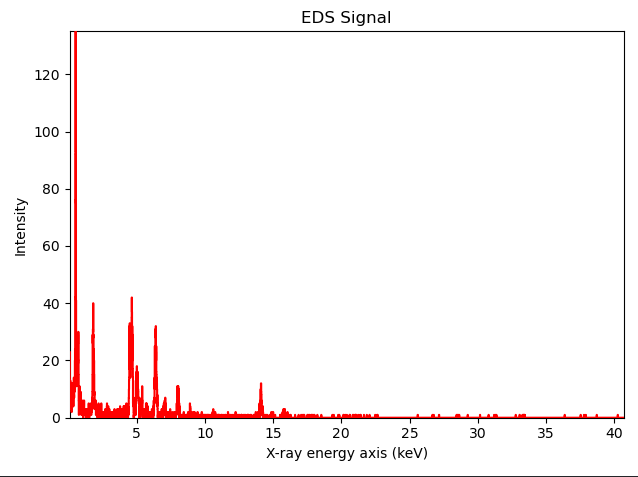
Improve setting x limits when plotting EDS signal, which can happen in cases, as the one described in #2899. Since this is not the first time that this question is asked and this is simple issue, it would be good to make it more convenient.

Progress of the PR

  • Display EDS spectrum from 0.1 keV,
  • update docstring (if appropriate),
  • [n/a] update user guide (if appropriate),
  • add an changelog entry in the upcoming_changes folder (see upcoming_changes/README.rst),
  • Check formatting changelog entry in the readthedocs doc build of this PR (link in github checks)
  • add tests,
  • ready for review.

Minimal example of the bug fix or the new feature

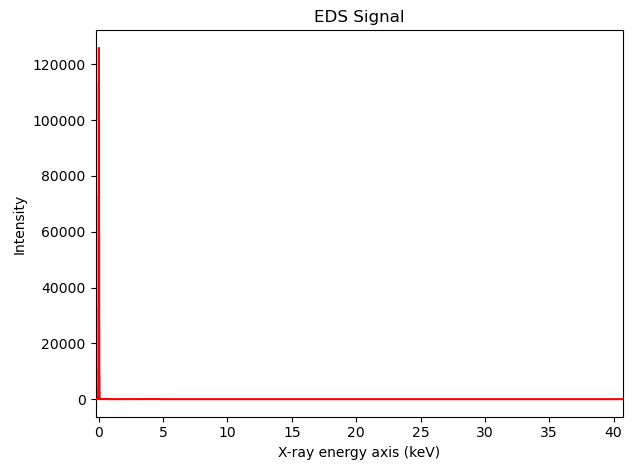
From the example given in #2899

import hyperspy.api as hs

# For Signal1D
s = hs.load('2030 8.00 Mx 0001.emd')[-1]
s.sum().plot()

# For Signal2D
ima = hs.datasets.example_signals.object_hologram()
ima.plot(display_range=(150, 400, 200, 450))

Before this PR:
image

With this PR:
image

@codecov
Copy link

codecov bot commented Jun 15, 2022

Codecov Report

Merging #2958 (5790878) into RELEASE_next_patch (8d37cc1) will increase coverage by 0.01%.
The diff coverage is 95.34%.

@@                  Coverage Diff                   @@
##           RELEASE_next_patch    #2958      +/-   ##
======================================================
+ Coverage               80.79%   80.80%   +0.01%     
======================================================
  Files                     209      209              
  Lines                   32696    32726      +30     
  Branches                 7321     7336      +15     
======================================================
+ Hits                    26416    26444      +28     
- Misses                   4516     4517       +1     
- Partials                 1764     1765       +1     
Impacted Files Coverage Δ
hyperspy/docstrings/plot.py 100.00% <ø> (ø)
hyperspy/drawing/signal1d.py 80.61% <93.75%> (+0.55%) ⬆️
hyperspy/_signals/eds.py 85.71% <100.00%> (+0.15%) ⬆️
hyperspy/drawing/image.py 74.30% <100.00%> (+0.36%) ⬆️

Continue to review full report at Codecov.

Legend - Click here to learn more
Δ = absolute <relative> (impact), ø = not affected, ? = missing data
Powered by Codecov. Last update 8d37cc1...5790878. Read the comment docs.

@ericpre ericpre linked an issue Jun 15, 2022 that may be closed by this pull request
@francisco-dlp
Copy link
Member

I am not sure if it is a good idea to adjust the x-limit to 0.1 keV automatically—this hides a feature of the data from the user, what can cause other issues. Wouldn't it be better to simply document this particularity of EDX datasets and suggest to crop the data using s.isig[0.1:] as a cure?

@francisco-dlp
Copy link
Member

Also, this looks more like an "enhancement" than a bug-fix to me. Do you agree @ericpre?

@@ -926,9 +927,15 @@ def plot(self,
set_elements, add_elements, estimate_integration_windows,
get_lines_intensity, estimate_background_windows
"""
if display_range is None:
axis = self.axes_manager[-1].axis
if len(axis) > 1 and axis[0] < 0.1:
Copy link
Member

Choose a reason for hiding this comment

The reason will be displayed to describe this comment to others. Learn more.

This assumes that the units are keV.

By the way, is this documented?

Copy link
Member Author

Choose a reason for hiding this comment

The reason will be displayed to describe this comment to others. Learn more.

Yes, you are right!

@ericpre
Copy link
Member Author

ericpre commented Jun 16, 2022

I am not sure if it is a good idea to adjust the x-limit to 0.1 keV automatically—this hides a feature of the data from the user, what can cause other issues. Wouldn't it be better to simply document this particularity of EDX datasets and suggest to crop the data using s.isig[0.1:] as a cure?

I was torn on this for a while and was thinking the same, however, I end up convincing myself that there is a use case to have this:

  • the issue with high intensity of zero energy peak in EDS spectrum is mentioned once in a while by users. As you said, this can be work around by using isig, but it come at the cost of making a copy of the data, which is not always an option. Assuming that 99% of the user aren't interested in the zero energy peak, it is useful to have it as default. The other 1% would be advanced EDS user and spend effort looking at the data can afford changing the default setting to their preference.
  • for Signall2D, I find it useful to be able to specify the range of displayed data without having to make a copy. An alternative to this would be use matplotlib differently, but there is currently a bug with the scalebar and it is more verbose.

Overall, because it is generic and the logic is simple (I can't think of any issue that it could cause and I don't expect any because it is simple logic, EDIT: clearly this statement didn't hold very long!! :D See #2958 (comment)), I came to the conclusion that this is a good compromise. The EDS plotting uses specific default values, which is not documented correctly.

Also, this looks more like an "enhancement" than a bug-fix to me. Do you agree @ericpre?

Yes, it is mostly an enhancement, on the edge being a bug! ;)

@francisco-dlp
Copy link
Member

isig doesn't make a copy of the data, just a view, so it shouldn't be a problem to use it/

The issue I see is that the offending channel is also an issue for decomposition and curve fitting. By taking it out of the view, we hide the issue, making it harder for the users to understand what's wrong in their analysis.

@jlaehne jlaehne added this to the v1.7.2 milestone Jul 26, 2022
@ericpre ericpre removed this from the v1.7.2 milestone Aug 26, 2022
@jlaehne jlaehne added this to the v1.7.2 milestone Aug 26, 2022
@ericpre ericpre removed this from the v1.7.2 milestone Aug 28, 2022
Sign up for free to join this conversation on GitHub. Already have an account? Sign in to comment
Projects
None yet
Development

Successfully merging this pull request may close these issues.

Hyperspy read 0s for EMD EDX spectrums
3 participants