Ranking genes between specific clusters in clonotype network #204
Comments
|
Hi Josine,
If you use the default options (i.e. don't specify the
an edge means "these two cells have the same clonotype" (when using identity metric), or "these two cells are in the same clonotype cluster" (when using a similarity metric). When using an identity metric, clusters are always fully connected. This is not necessarily the case when using a similarity metric.
No, the distance has no meaning. This is just an artifact from the layouting algorithm. When using a similarity metric, edges are colored by the distance, but the point can be made that it's hard to see (one could experiment with the
You can just subset the adata_subset = adata[adata.obs["clonotype"].isin(["23", "42"]), :]
ir.tl.clonotype_network(adata_subset)
ir.pl.clonotype_network(adata_subset)
You just need to find out which clonotypes have more than two samples. There are many ways to do this, here's an (untested) approach using pandas. You can then subset samples_per_clonotype = adata.obs.groupby("clonotype").apply(lambda group_df: len(set(group_df["batch"])))
clonotypes_with_two_or_more_samples = samples_per_clonotype[samples_per_clonotype > 2].index
Set
This is exactely how it should work. There's also an example in the tutorial. Do you get any error message? Cheers, |
|
Dear Gregory,
Thanks so much for your reply. All is clear to me now, except from the last part. I did see the (last) example in the tutorial<https://icbi-lab.github.io/scirpy/tutorials/tutorial_3k_tcr.html>, which is what I'd need (partly), however:
* When I plot my clonotype network it doesn't show the number of the clonotype, so how can I determine which ones I have to select, what name (in tutorial it is "163_TCR" and "277_TCR")?
* How can I plot differentially expressed genes between the two batches (samples) within one clonotype? I was able to plot which clonotypes look like they consist of both samples, see second graph where orange is organ 1, and blue is organ 2 (again, I don't know what number they have though).
Thanks 🙏 🙏
…________________________________
From: Gregor Sturm <notifications@github.com>
Sent: Thursday, October 15, 2020 5:31 AM
To: icbi-lab/scirpy <scirpy@noreply.github.com>
Cc: Jansen, Josephina <josephina.jansen@yale.edu>; Author <author@noreply.github.com>
Subject: Re: [icbi-lab/scirpy] Ranking genes between specific clusters in clonotype network (#204)
Hi Josine,
If using the Scirpy clonotype_network tool the 'sequence' is set to 'nt', are the clusters in the clonotype network (where each node represents a cell) based on identical nucleotide sequences
If you use the default options (i.e. don't specify the metric parameter) it will be based on sequence identity.
b) Do the lines that connect the cells within a cluster have any meaning?
an edge means "these two cells have the same clonotype" (when using identity metric), or "these two cells are in the same clonotype cluster" (when using a similarity metric). When using an identity metric, clusters are always fully connected. This is not necessarily the case when using a similarity metric.
In the plot above, is it correct that the closer the different clusters are together, the more similar their nucleotide sequences are? Meaning that the sequences of the clonotypes consisting of only 2 cells in this case are most different from the clonotype clusters consisting of >5 cells (as they are further apart)?
No, the distance has no meaning. This is just an artifact from the layouting algorithm.
When using a similarity metric, edges are colored by the distance, but the point can be made that it's hard to see (one could experiment with the edges_cmap parameter<https://nam05.safelinks.protection.outlook.com/?url=https%3A%2F%2Ficbi-lab.github.io%2Fscirpy%2Fgenerated%2Fscirpy.pl.clonotype_network.html%23scirpy.pl.clonotype_network&data=02%7C01%7Cjosephina.jansen%40yale.edu%7C29850f5cb43d4344859c08d870ed2abb%7Cdd8cbebb21394df8b4114e3e87abeb5c%7C0%7C0%7C637383511218813579&sdata=AvqLZI1jW0CCSQWv71u72yhUx39RAvo8Zrb%2BXe2T8Ow%3D&reserved=0>).
how can I select specific clusters in the clonotype network graph
You can just subset the AnnData object, e.g.
adata_subset = adata[adata.obs["clonotype"].isin(["23", "42"]), :]
ir.tl.clonotype_network(adata_subset)
ir.pl.clonotype_network(adata_subset)
How can I assign numbers to my clusters based on identical nucleotide sequences shared between two samples?
You just need to find out which clonotypes have more than two samples. There are many ways to do this, here's an (untested) approach using pandas. You can then subset adata as described above.
samples_per_clonotype = adata.obs.groupby("clonotype").apply(lambda group_df: len(set(group_df["batch"])))
clonotypes_with_two_or_more_samples = samples_per_clonotype[samples_per_clonotype > 2].index
How can I add a legend to my plot, and how can I change the name 'batch' into 'sample'?
Set legend_loc="right margin". The easiest way to change the title is to rename the column. Alternatively, you can retrieve the matplotlib.Axes object<https://nam05.safelinks.protection.outlook.com/?url=https%3A%2F%2Fmatplotlib.org%2F3.1.1%2Fapi%2Faxes_api.html&data=02%7C01%7Cjosephina.jansen%40yale.edu%7C29850f5cb43d4344859c08d870ed2abb%7Cdd8cbebb21394df8b4114e3e87abeb5c%7C0%7C0%7C637383511218823568&sdata=ZQhAxjBlEjDqts%2F54BTEmNS22d%2Bnxp%2FaJKKdyjkYh1U%3D&reserved=0> and call set_title. This is also the way to go if you further want to customize the plot.
1. Using Scirpy, how can one best specify differentially expressed genes (based on the transcriptomics data) between the different clusters based on shared nucleotide sequences between blood and fat, for example cluster 1 vs. rest of the clusters, and cluster 1 and 2 vs. cluster 3 and 4? I have tried implementing Scanpy's tool to rank genes using WIlcoxon, but unfortunately I can't make It work.
This is exactely how it should work. There's also an example in the tutorial<https://nam05.safelinks.protection.outlook.com/?url=https%3A%2F%2Ficbi-lab.github.io%2Fscirpy%2Ftutorials%2Ftutorial_3k_tcr.html%23Marker-genes-in-top-clonotypes&data=02%7C01%7Cjosephina.jansen%40yale.edu%7C29850f5cb43d4344859c08d870ed2abb%7Cdd8cbebb21394df8b4114e3e87abeb5c%7C0%7C0%7C637383511218823568&sdata=hLGoxDC9fc%2FJPZn2RjJLmMdL1fu3Y%2Bci965atHKeqh0%3D&reserved=0>. Do you get any error message?
Cheers,
Gregor
—
You are receiving this because you authored the thread.
Reply to this email directly, view it on GitHub<https://nam05.safelinks.protection.outlook.com/?url=https%3A%2F%2Fgithub.com%2Ficbi-lab%2Fscirpy%2Fissues%2F204%23issuecomment-709038904&data=02%7C01%7Cjosephina.jansen%40yale.edu%7C29850f5cb43d4344859c08d870ed2abb%7Cdd8cbebb21394df8b4114e3e87abeb5c%7C0%7C0%7C637383511218833564&sdata=8QwH0MUX9ebHwXHedN5tC0jfoI35ITGeghBimAOHaQs%3D&reserved=0>, or unsubscribe<https://nam05.safelinks.protection.outlook.com/?url=https%3A%2F%2Fgithub.com%2Fnotifications%2Funsubscribe-auth%2FAQ355Z4PQQSSIZSJIFRY3F3SK26Q5ANCNFSM4SRNZV6A&data=02%7C01%7Cjosephina.jansen%40yale.edu%7C29850f5cb43d4344859c08d870ed2abb%7Cdd8cbebb21394df8b4114e3e87abeb5c%7C0%7C0%7C637383511218833564&sdata=sZ9mtUyLMVJIQynhptvrfRFBA%2BP8zSe24Q8IIFZBT5w%3D&reserved=0>.
|
|
Hi Josine, glad I could help :)
You'll have to plot the clonotype network colored by ir.pl.clonotype_network(adata, color="clonotype", legend_loc="on data")Actually, it would be nice to show overlay the clonotype number also if colored by other categories, I'll consider implementing that.
Once you found out the clonotype number, you can again subset adata_subset = adata[adata.obs["clonotype"].isin(["23", "42"]), :]
sc.tl.rank_genes_groups(adata_subset, 'batch', method="wilcoxon")Let me know if there are further issues! Best, |
|
Dear Gregor, Ranking the DE genes between specific clonotypes now works perfectly, as does ranking DE genes within one clonotype that is shared between two organs, so first of all: thank you! My other scripts seem to throw some errors, could you perhaps point me into the right direction once more? When ranking DE genes between different subsets of clonotypes, I create multiple subsets, as suggested by your previous comment, for example:
Unfortunately the following lines then throw an error:
ValueError: reference = final_data_subset2 needs to be one of groupby = ['0', '1', '2', '3', '4', '5', '6', '7', '8', '9', '10', '11', '12', '13', etc.] Subsequently, I tried the following, but there was another error:
ValueError: reference = ('848', '996') needs to be one of groupby = ['0', '1', '2', '3', '4', '5', '6', '7', '8', '9', '10', '11', '12', '13’, etc.] Not sure what I am doing wrong, how can I best solve these errors?** Appreciatively, |
|
Hi Josine, the first one doesn't work, because you are defining two variables ( I initially thought your second approach should work, but apparently, scanpy only accepts a single group as reference, not a list. To make this work, I would create an additional column in # initialize the whole column with 'other'
adata.obs["my_groups"] = "other"
# set the corresponding rows in the "my_groups" column to 'group1'.
# .loc works like this: .loc[ ROW_LABELS, COL_LABELS ]
adata.obs.loc[adata.obs["clonotype"].isin(["908", "9775", "2488", "501"]), "my_groups"] = "group1"
adata.obs.loc[adata.obs["clonotype"].isin(["100"]), "my_groups"] = "group2"Then you can do sc.tl.rank_genes_groups(adata, "my_groups", groups="group1", reference="group2", method='wilcoxon')Best, P.S.: you can format code in github using backticks: |
|
Topic: DE genes between organ 1 cells belonging to the clonotypes that have identical CDR3 sequences in both organ 1 and 2 & NON-clonotypes in organ 1 So subset 1 now only consists of clonotypes that have a shared cdr3_nt sequence in organ 1 as well as in organ 2, thanks for helping me with that - really needed, because I am such a freshman in both Scanpy & Scirpy (actually every package/Python 🙈). I would like to make two other subsets to only check for DE genes between the organ 1 cells that are part of subset 1 (which should create subset 2), and the organ 1 cells that belong to the NON-clonotypes (= singletons) (constructing subset 3). I think subset 2 would need to be:
But how to fix subset 3 and define DE between subset 2 and 3?I tried the following methods (none of which works completely): Method 1)
Not sure if this is the right direction, and getting many errors here. Method 2)
Overlaying with number so to select the ones for subset 3:
Method 3)
Do you have any coding suggestion to create subset 3 and define DE between subset 2 and 3? Many, thanks (again), |


|
One more question: When I run the following code, the intended graphs are displayed for some clonotypes, but not for others.
Error: 'ZeroDivisionError' How to solve this? |
|
Hi Josine, you are on the right track with making a column (as unfortunately can't do the DE comparison between subsets with scanpy). However, there are a few (pandas) problems with your steps, I'll try to explain what's wrong:
Like that you just assign a string (
You can have that easier by using the
Here you assign Alternatively, you can use the cell indexes from the subset you created to assign the values: adata.obs.loc[adata_subset_organ1_from_clonotypes.obs_names, "my_groups"] = "group2"`Maybe this tutorial could help you to familiarize yourself with the pandas indexes: I think a short version of what you're trying to achieve could look like this: # Step 1: create "boolean masks", i.e. arrays with the same length as adata.obs
# that indicate if a certain row meets a certain condition
is_organ1 = (adata.obs["batch"] == "organ1")
is_singleton = (adata.obs["clonotype_size"] == 1)
# (or just use directly what you used to create subset1)
is_subset1 = adata.obs_names.isin(adata_subset1.obs_names)
# Step 2: create a column using the masks. & means boolean
# and, i.e. decide for each row if both conditions are true
adata.obs["new_col"] = "other"
adata.obs.loc[is_subset1 & is_organ1, "new_col"] = "subset1+organ1"
adata.obs.loc[is_organ1 & is_singleton, "new_col"] = "singleton+organ1"Then you can perform the wilcox test as you already know.
I suspect this happens if there are too few/no cells in a subset and no meaningful ranks can be computed for the genes. I would check the gene expression of these groups manually (e.g. using a scanpy matrixplot) to get an idea. |
|
Thanks so much for your help/suggestions, they have been very useful and I can apply them now for my other analyses! |
|
Hi Gregor, I have a question in line with the thread above: how can I save only the annotated data from one batch (organ_1) within a clonotype (number 1116) to .csv? The reason I am asking is: I'd like to perform some pathway analyses, but the software I am using requires .csv format. I think the annotated data belonging to clonotype 1116 can be saved like this: But the following does not work, which I can understand (AttributeError: 'DataFrame' object has no attribute 'obs'): However, I can't think of another way to save the annotated data belonging to batch = Organ 1, specifically from clonotype 1116? Your help would again be much appreciated. Thanks in advance, |
|
This sounds like you try to get an `obs` from an `obs`
```
# df is a dataframe
df = adata.obs
# error!
df2 = df.obs
# but you can save a dataframe directly
df.to_csv()
```
…On Tue, Nov 10, 2020, 05:18 Josine ***@***.***> wrote:
Question: how can I save only the annotated data from one batch (organ_1)
within a clonotype (number 1116) to csv?
Clonotype1116 = adata[adata.obs["clonotype"].isin(["1116"]), :]
I think the annotated data belonging to clonotype 1116 can be saved like
this:
Clonotype1116.obs.to_csv('Filename', sep=',')
But the following does not work, which I can understand (AttributeError:
'DataFrame' object has no attribute 'obs'):
File_Organ1 =
Clonotype1116.obs.loc[Clonotype1116.obs["batch"].isin(["tumor"])]
FIle_Organ1.obs.to_csv('Filename', sep=',')
How can the annotated data belonging to batch = Organ 1 from clonotype
1116 be saved?
—
You are receiving this because you commented.
Reply to this email directly, view it on GitHub
<#204 (comment)>,
or unsubscribe
<https://github.com/notifications/unsubscribe-auth/ABVZRVYEJQ533HPSBM3ABO3SPC5K3ANCNFSM4SRNZV6A>
.
|
|
Thanks, I see. Saving the df directly works in general, but not when trying to save only the data belonging to cells in a specific batch within a clonotype. The following error then occurs: "AttributeError: 'DataFrame' object has no attribute 'write_csvs'" Saving data belonging to for example one clonotype works: Saving annotated data from all cells from the batch 'organ1' within clonotype '1116' does not work, however that's what I'd like to end up with: |
|
It's a detail ;)
The former will only save the |
|
OH, 🙈THANK YOU!!! |
|
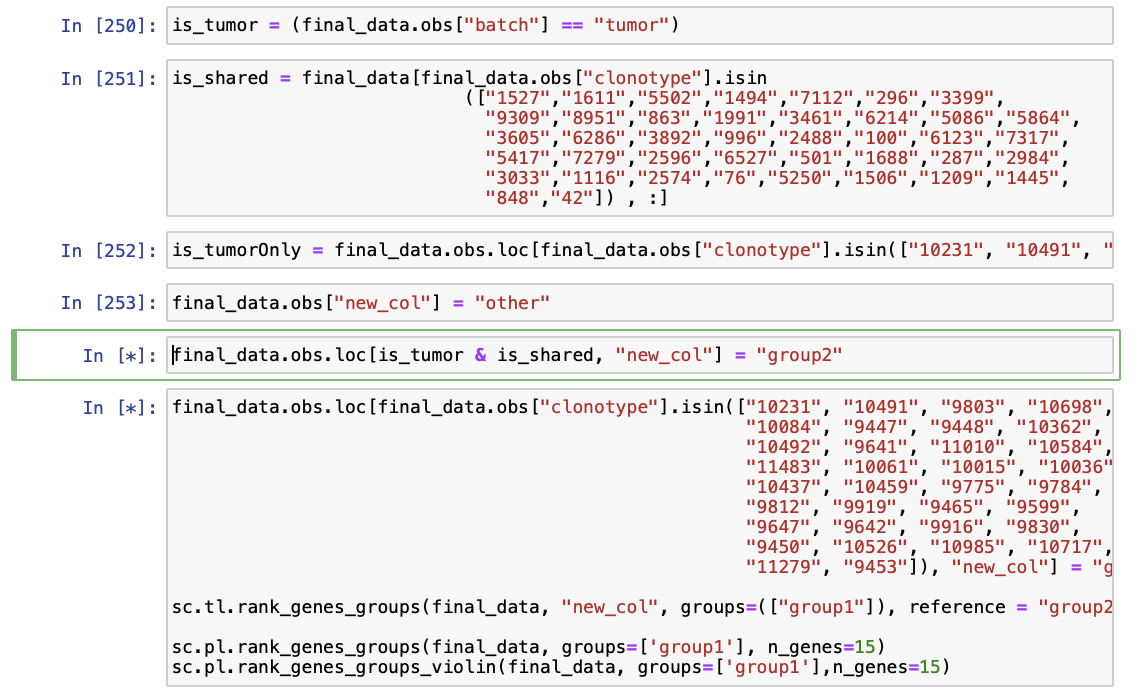
Hi again, so I have tried many things now, but I am not proceeding with the following: What am I doing wrong: As you suggested, here is step 1 to create boolean masks
Step 2: create a column using the masks and decide for each row if both conditions are true Setting the groups here, first brain only: Second group is from shared clonotypes the tumor cells:
The script keeps hanging on the line with '& - sign', or there are errors with invalid syntax. Really not sure what I am doing wrong, I have read the documentation that you suggested. Thank you, Josine |
|
Hi Josine, can you please always include the complete error message? Otherwise it's hard to tell what the actual problem is.
I spot an unmatched bracket Best, |
|
Hi Gregor, So yesterday and today no error, just hangs forever (see above). I have restarted the kernel multiple times, but it doesn't seem to work. As you can see I use somewhat different names to describe the groups than I used above, so please don't get confused :) -> It should be pretty straight-forward what indicates the different groups. Thanks for your time, best, Josine |
tbh, I don't know why this is not throwing an error though |
|
Hi Josine, I'm closing this issue for now. Feel free to reopen, or create a new one, if you have further questions. Best, |
Dear ICBI lab,
I have some questions regarding the Scirpy package, I would really appreciate your help.
For my analyses I first merged TCR and transcriptomics data from two different samples (organ 1 and organ 2), subsequently I then merged these two files.
1. a) If using the Scirpy clonotype_network tool the 'sequence' is set to 'nt', are the clusters in the clonotype network (where each node represents a cell) based on identical nucleotide sequences, or is it based on similarity, meaning that one cluster could consists of cells with slightly different nucleotide sequences?
As I understand, each node represents a cell, and edges connect cells belonging to the same clonotype. The function makes visualization of the clonotype-network possible, analogous to the construction of a neighborhood graph from transcriptomics data with the Scanpy package, so that based on the above, it computes a neighborhood graph of CDR3 nucleotide sequences with "scirpy.pp.tcr_neighbors())". However answer to my question I couldn't find, I was hoping you can help me out?
b) Do the lines that connect the cells within a cluster have any meaning?
c) In the plot above, is it correct that the closer the different clusters are together, the more similar their nucleotide sequences are? Meaning that the sequences of the clonotypes consisting of only 2 cells in this case are most different from the clonotype clusters consisting of >5 cells (as they are further apart)?
2. a) The package allows for specifying what organs the clusters consist of:
My question is: how can I select specific clusters in the clonotype network graph (I only would like to include the clonotypes in the network that have identical clonotypes between the two different samples from my data, i.e. organ 1 and organ 2), meaning that in the plot above I would like to filter for the clusters only that display both blue and orange nodes.
b) How can I assign numbers to my clusters based on identical nucleotide sequences shared between two samples?
c) How can I add a legend to my plot, and how can I change the name 'batch' into 'sample'?
3. Using Scirpy, how can one best specify differentially expressed genes (based on the transcriptomics data) between the different clusters based on shared nucleotide sequences between blood and fat, for example cluster 1 vs. rest of the clusters, and cluster 1 and 2 vs. cluster 3 and 4? I have tried implementing Scanpy's tool to rank genes using WIlcoxon, but unfortunately I can't make It work.
sc.tl.rank_genes_groups(adata, 'clonotype', groups=['1','2'], reference=['3','4'], method='wilcoxon')
sc.pl.rank_genes_groups(adata, groups=['1', '2'], n_genes=20)
-The key of the observations grouping to be considered would be:
"clonotype clusters based on share identical nucleotide sequences between organ 1 and organ 2".
-Subset of groups to which comparison wouldl be restricted: "clonotype 1 and clonotype 2"
-Comparison: Compare with respect to a specific group
-Group identifier with respect to which compare: "clonotype 3 and clonotype 4"
“The number of genes that appear in the returned tables”: 100
“Method”: Wilcoxon-Rank-Sum
Thanks in advance,
Josine
The text was updated successfully, but these errors were encountered: