![]()
PIPE-T is Galaxy tool that offers several state-of-the-art options for parsing, filtering, normalizing, imputing and analyzing RT-qPCR expression data. Integration of PIPE-T into Galaxy allows experimentalists with strong bioinformatic background, as well as those without any programming or development expertise, to perform complex analysis in a simple to use, transparent, accessible, reproducible, and user-friendly environment.
How to install PIPE-T [toc]
PIPE-T can be easily installed from the Main ToolShed or using Docker system.
From the galaxy toolshed [toc]
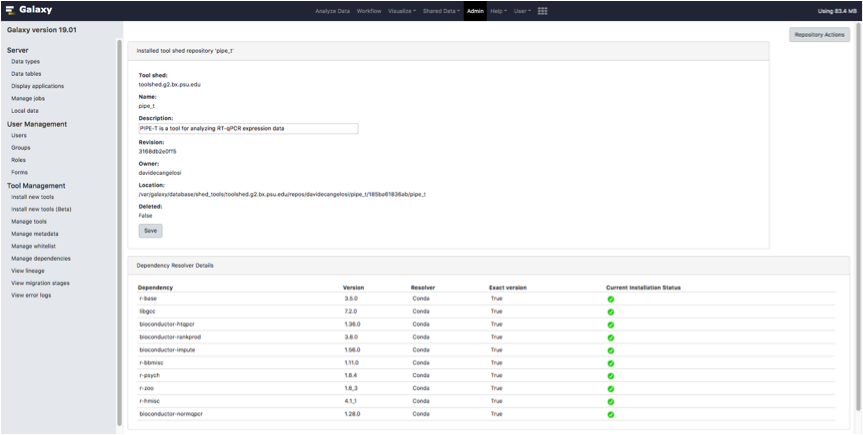
PIPE-T installation from the Main ToolShed repository
To install PIPE-T from the Main Tool Shed, you need an Admin account on your Galaxy Project instance.
During PIPE-T installation setup, we recommend installing dependencies through Conda.
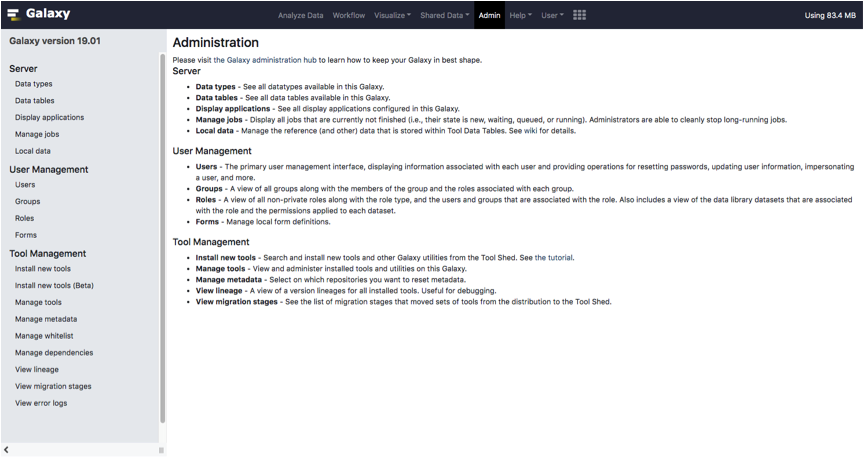
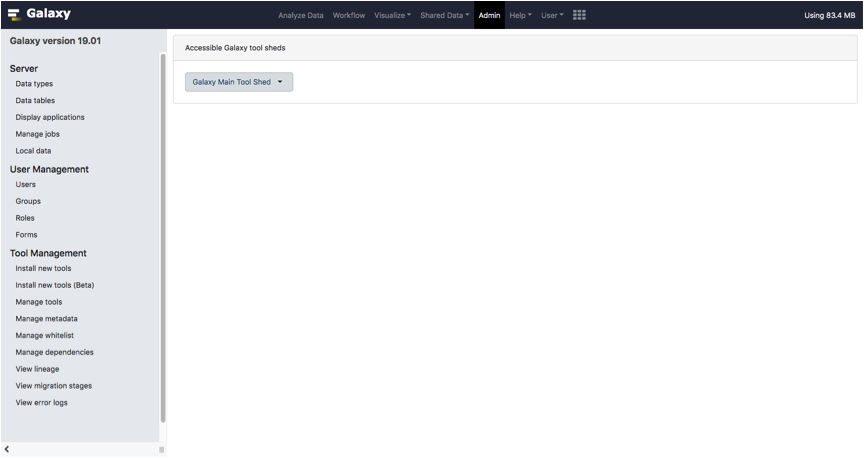
To fetch PIPE-T installation, click on the link Install new tools located in the Admin tab of your Galaxy index page.
Click on the Galaxy Main Tool Shed button.
Type pipe_t in the searchbox located on top of the page.
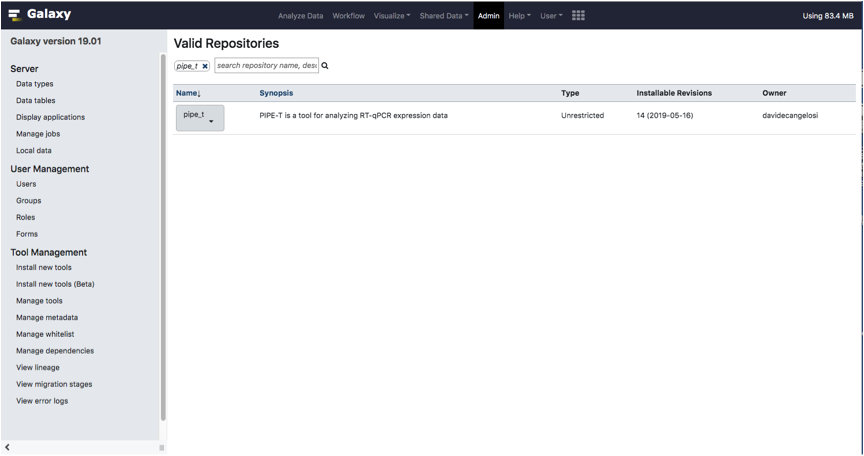
PIPE-T tool will appear in the same page.
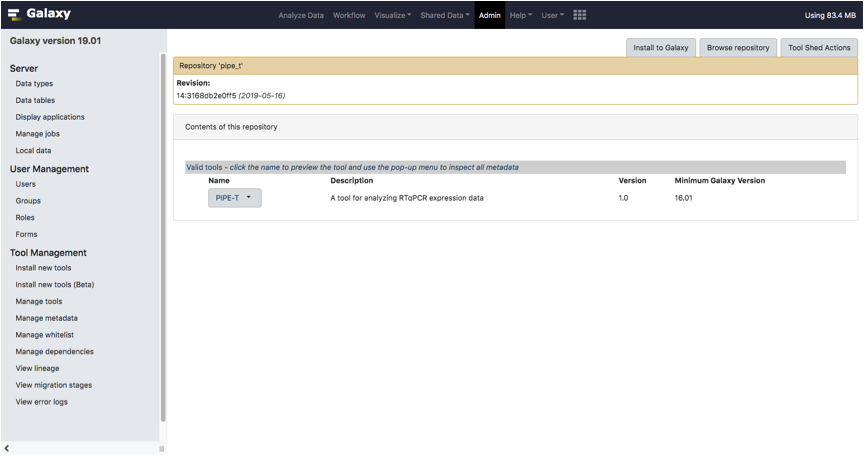
Click on the Preview and install option located in the dropdown menu of the tool.
Select one of the available revisions and click on the Install to Galaxy.
Type PIPE-T in the box Add new tool panel section and click the Install button as it is shown in the screenshot below.
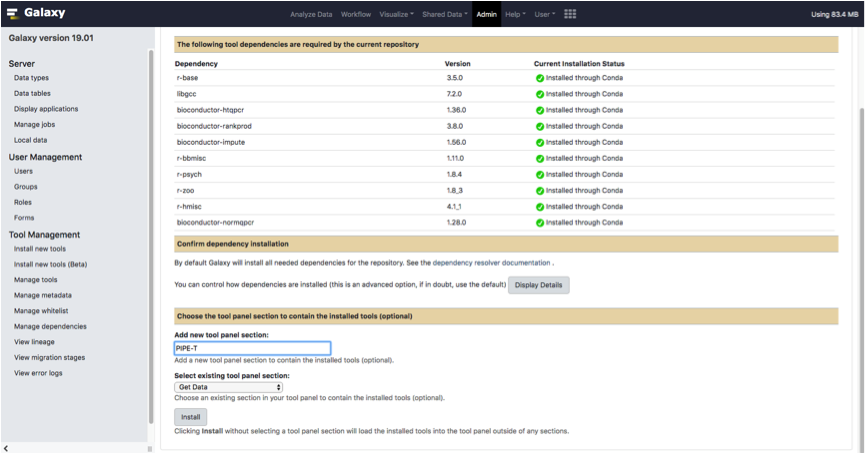
Wait until all dependencies are resolved.
Now, you can start your analysis with PIPE-T. For detailed instructions about tools installation visit the Galaxy documentation website.
Using Docker  [toc]
[toc]

A dockerized version of Galaxy containing PIPE-T, based on bgruening galaxy-stable is also available.
At first you need to install Docker. Please follow the instructions to install docker based on your machine OS:


After the successful installation, all you need to do is:
docker run --rm -d -p 21:21/tcp -p 443:443/tcp -p 80:80/tcp -p 8800:8800/tcp -p 9002:9002/tcp davidecangelosi/galaxy-pipe-t:latest
If you already have run galaxy-pipe-t with docker and want to fetch the last docker image of galaxy-pipe-t, type
docker pull davidecangelosi/galaxy-pipe-t
docker run -d -p 21:21/tcp -p 443:443/tcp -p 80:80/tcp -p 8800:8800/tcp -p 9002:9002/tcp davidecangelosi/galaxy-pipe-t
Then, you just need to open a web browser (chrome or firefox are recommanded) and type
http://localhost
into the adress bar to access Galaxy running PIPE-T.
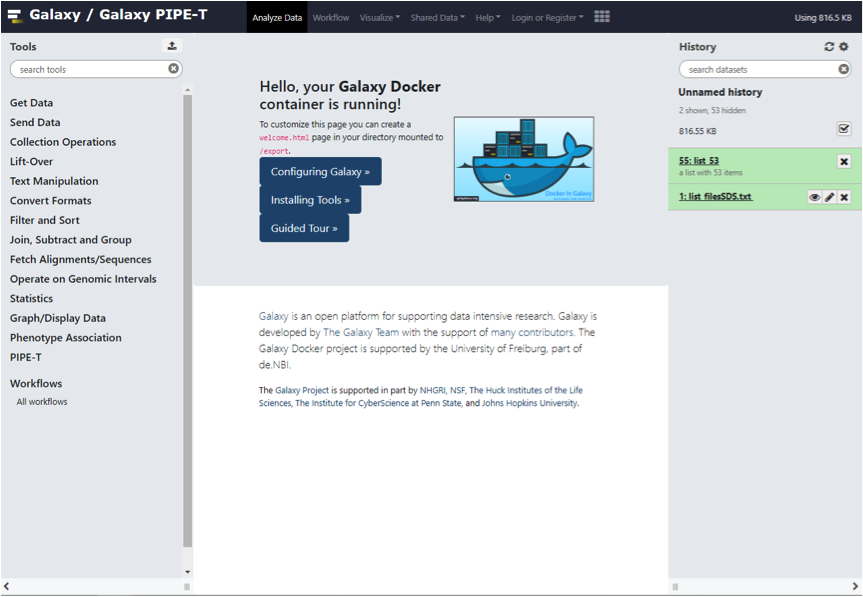
The Galaxy Admin User has the username admin@galaxy.org and the password 1234. In order to use some features of Galaxy, like import history, one has to be logged in with this username and password.
Docker images are "read-only", all your changes inside one session will be lost after restart. This mode is useful to present Galaxy to your colleagues or to run workshops with it. To install Tool Shed repositories or to save your data you need to export the calculated data to the host computer.
Run this command:
    docker create -v /export \
    --name pipe-t-store \
    davidecangelosi/galaxy-pipe-t \
    /bin/true
and then run:
    docker run -d -p 21:21/tcp -p 443:443/tcp -p 80:80/tcp -p 8800:8800/tcp -p 9002:9002/tcp \
    --volumes-from pipe-t-store \
    davidecangelosi/galaxy-pipe-t:latest
For more information about the parameters and docker usage, please refer to https://github.com/bgruening/docker-galaxy-stable/blob/master/README.md#Usage
How to analyse data with PIPE-T [toc]
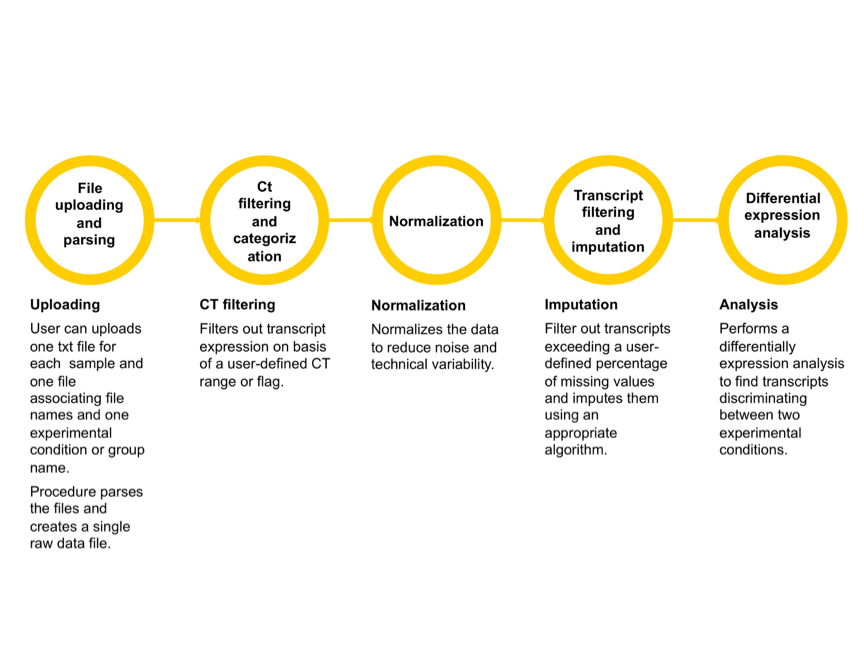
PIPE-T offers several options for the analysis of RT-qPCR data. The main steps are summarized in the following figure.
To start any PIPE-T execution, users must upload two types of input files:
- A List collection of tab-separated text files containing the resulting data of the RT-qPCR experiment (ListOfFile)
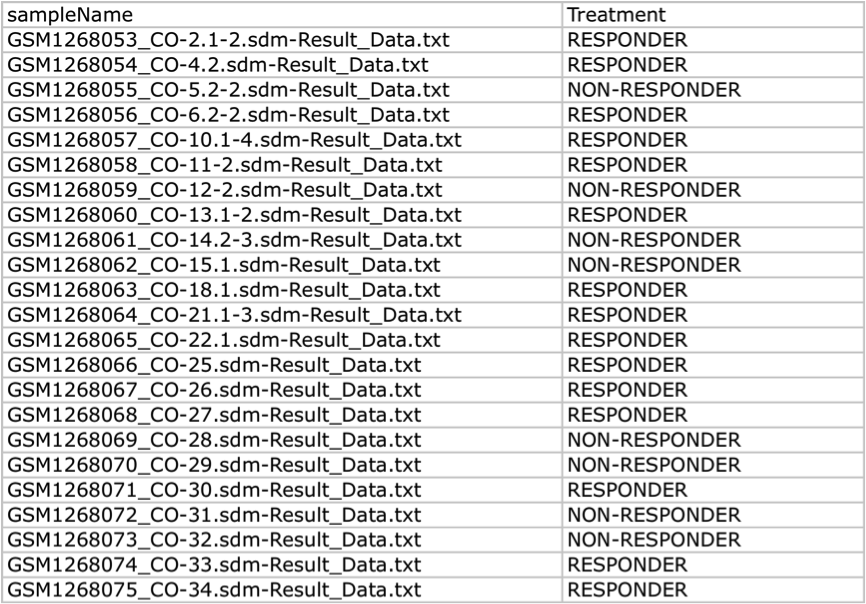
- A tab-separated text file associating each filename in ListOfFile with a treatment group (FileTreatment).
File formats must be carefully checked before starting uploading the files in Galaxy. Here, we list some hints about the fileTreatment file format
- fileTreatment must be a tab-delimited txt file.
- fileTreatment must have only two columns named sampleName and Treatment.
- Be sure that sampleName matches the name and the extension of the files in ListOfFile
- Omit any special symbol when you specify a sampleName or a Treatment.
Here, we list some hints about the ListOfFile list format:
- Each file in ListOfFile must be a tab-separated text file.
- Use the dot as decimal separator.
- Be sure that no special symbol was introduced in the files.
- Feature and column names must be the same in all input files
- Each file in ListOfFile must refer to one sample.
- Check that the feature type is specified as Target or Endogenous Control.
- SDS and EDS are the only formats with a header in the first rows of the file. PIPE-T automatically discard these header rows before parsing the content of these files. For this reason, the first column of the columns row must start by the symbol # for a SDS file and by the word Well for a EDS file.
- Be sure that each file contains at least the following column names:
- For format EDS: EXPFAIL, Target Name, Well Position, and CT,
- For format plain: flag as 4th column, feature as 6th column, type as 7th column, position as 3th column, and Ct as 8th column,
- For format SDS: Omit, Detector, Task, and Avg Ct,
- For format LightCycler: Name, Pos, and Cp,
- For format CFX: Content, Well, Cq Mean,
- For format OpenArray: ThroughHole.Outlier, Assay.Assay.ID, Assay.Assay.Type, ThroughHole.Address, and ThroughHole.Ct,
- For format BioMark: Call, Name 1, ID, and Value.
- Be sure that flag of all features is one of the following values:
- For format EDS: Y or N,
- For format plain: Flagged or Passed,
- For format SDS: TRUE or FALSE,
- For format LightCycler: Y or N,
- For format CFX: Y or N,
- For format OpenArray: TRUE or FALSE,
- For format BioMark: Fail or Pass.
One single execution of PIPE-T produces the following output files:
- A tab-separated text file containing the raw Ct values for every samples and transcript
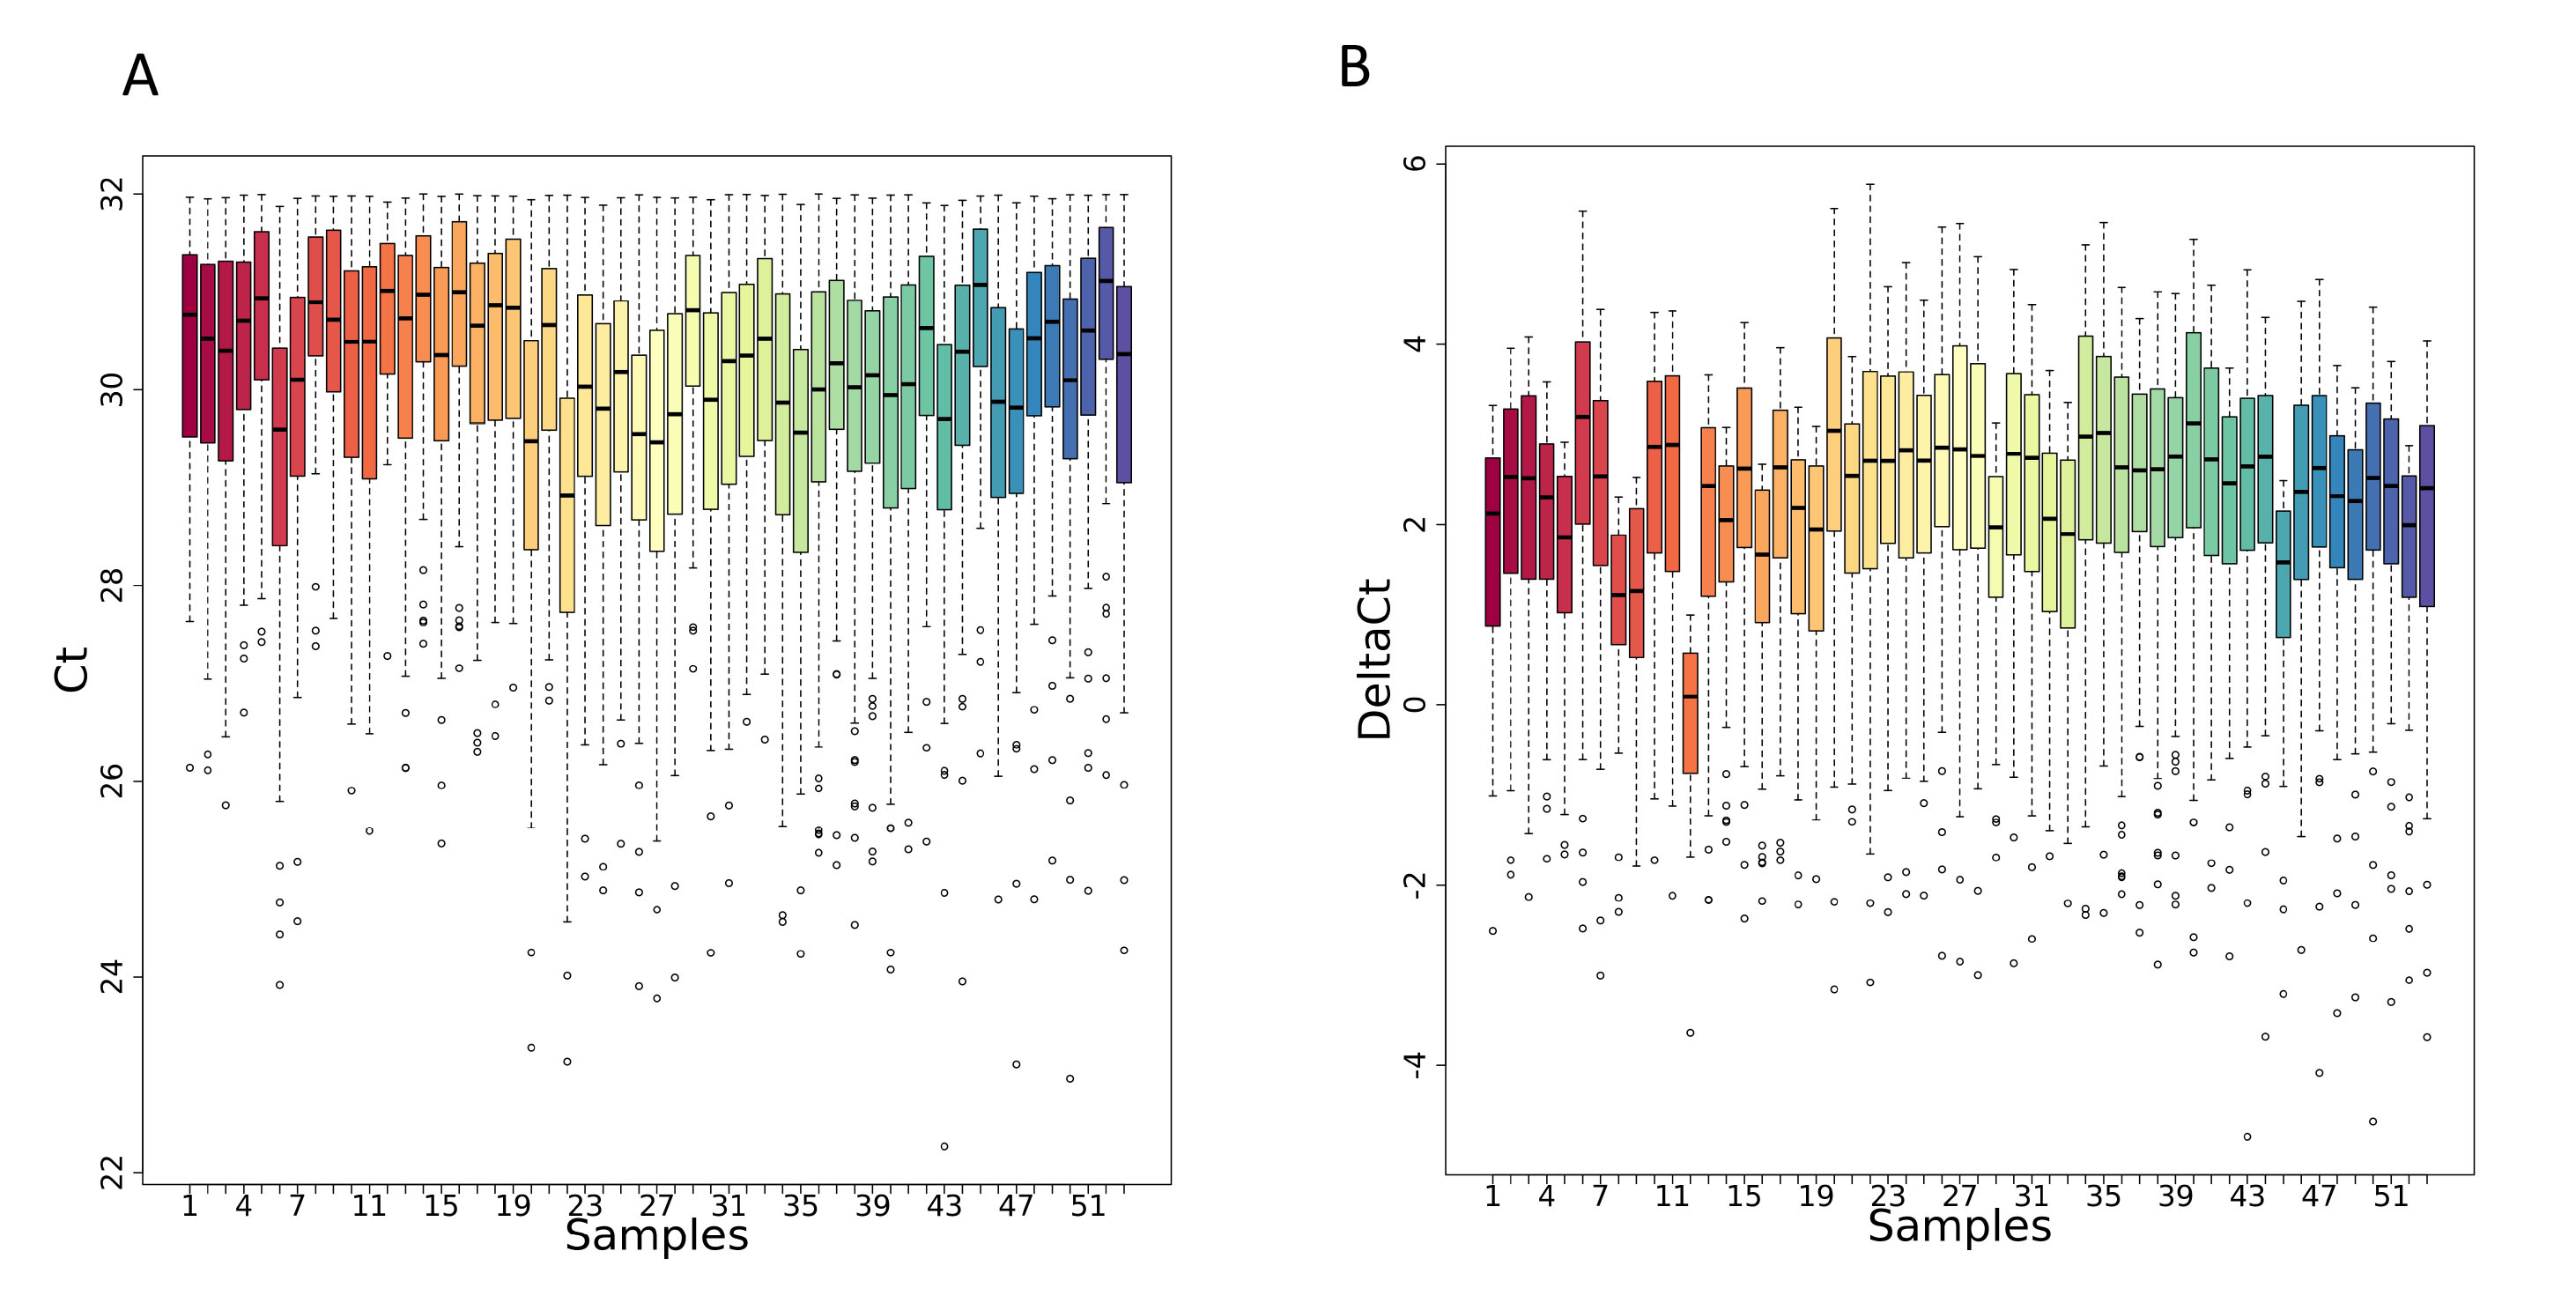
- A PNG file showing the distribution of the Ct values of every samples obtained after the Ct filtering and categorization step visualized as sequence of boxplots.
- A tab-separated text file containing the normalized Ct values
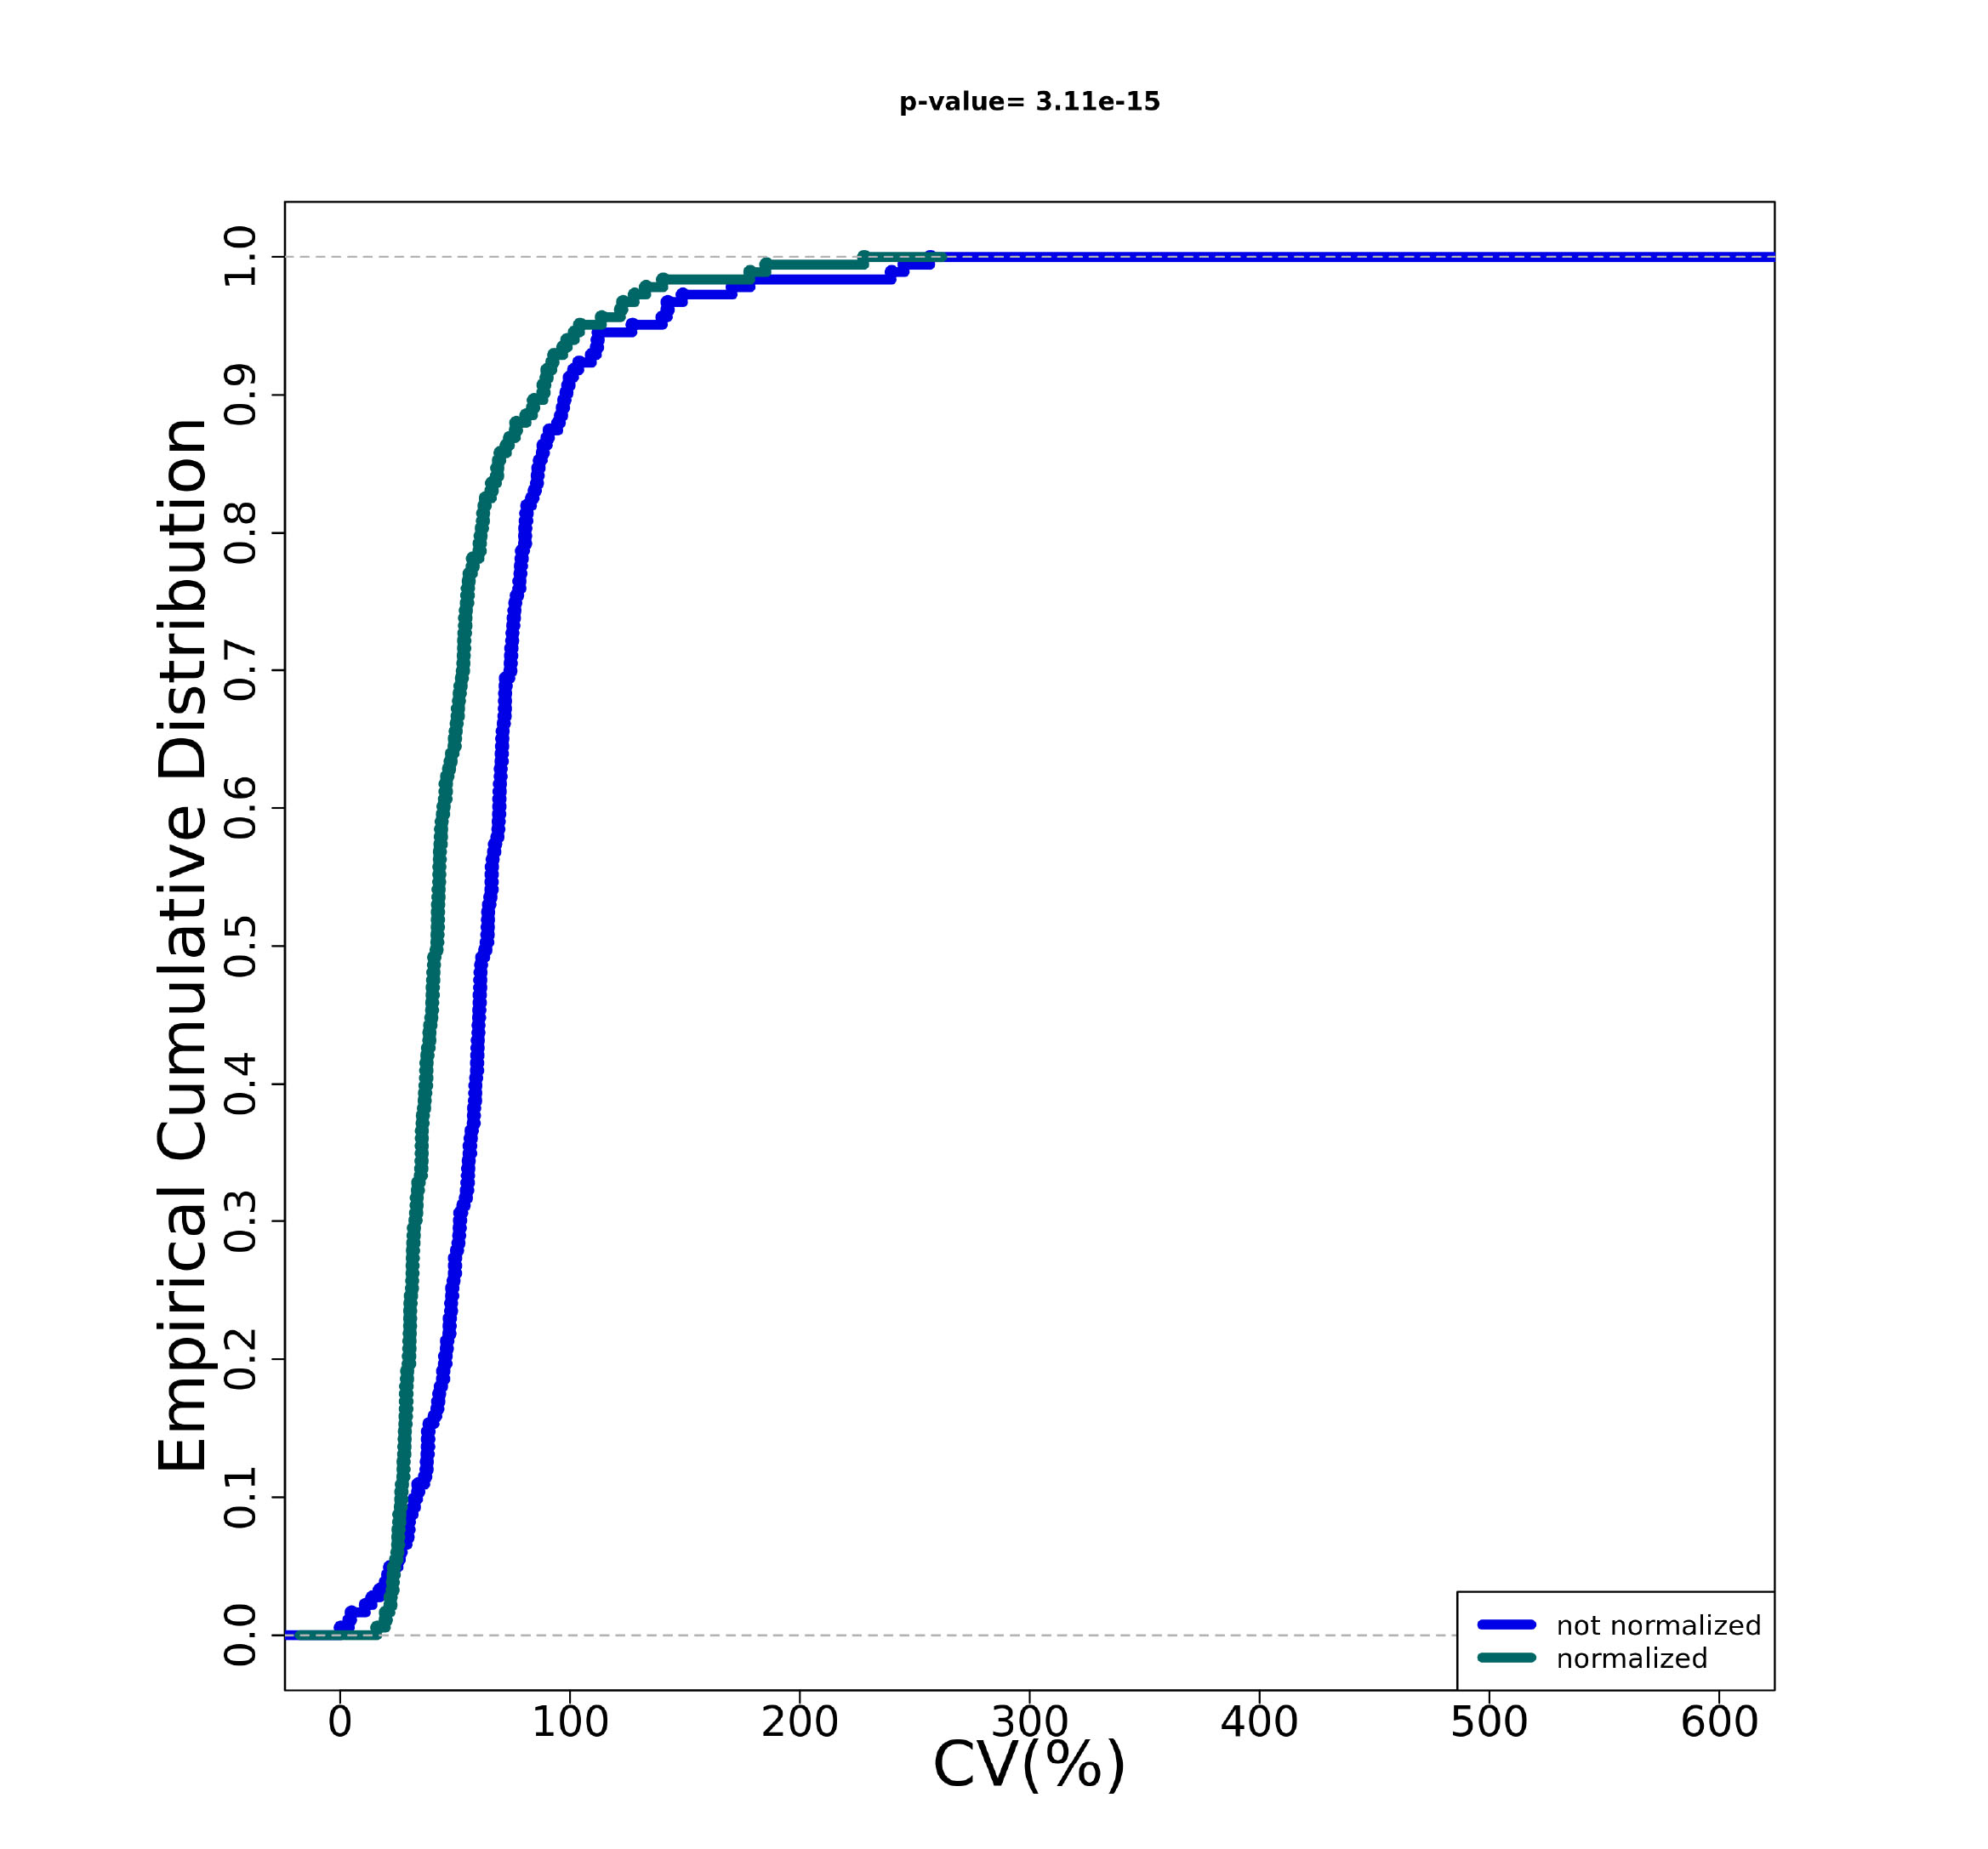
- A PNG file showing the cumulative distribution plot before and after data normalization of the coefficient of variation of every transcript.
- A PNG file showing the distribution of the normalized Ct values visualized as sequence of boxplots.
- A tab-separated text file containing data after imputation
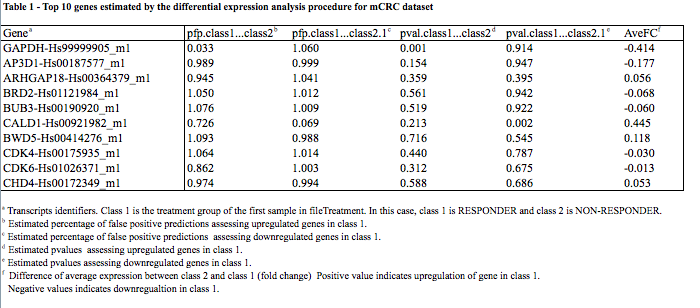
- A tab-separated text file containing the results of the differential expression analysis.
Example application [toc]
In this example, we will show you how to perform a simple analysis with PIPE-T on mCRC data. We have chosen the 53 metastatic colorectal cancer study whose gene expression profile was available in the Gene Expression Omnibus with accession GSE52513.
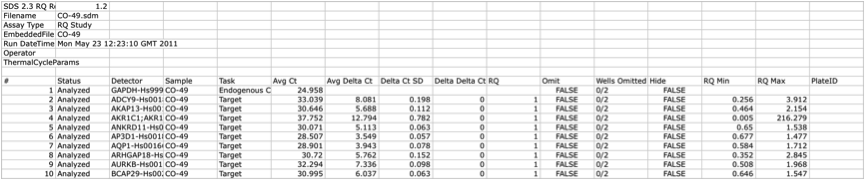
The top rows relative to an example file of a hypothetical ListOfFile is reported in the table below. Note that file contains data about the type of the file, dates and any other relevant information about the experiment.
An example FileTreatment is reported in the table below. Note two columns named sampleName and Treament compose that file.
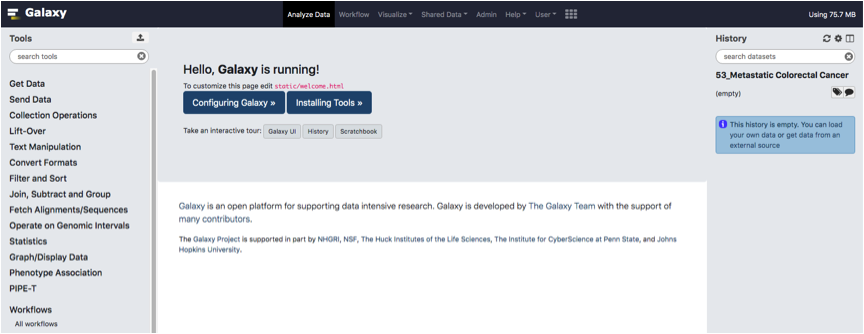
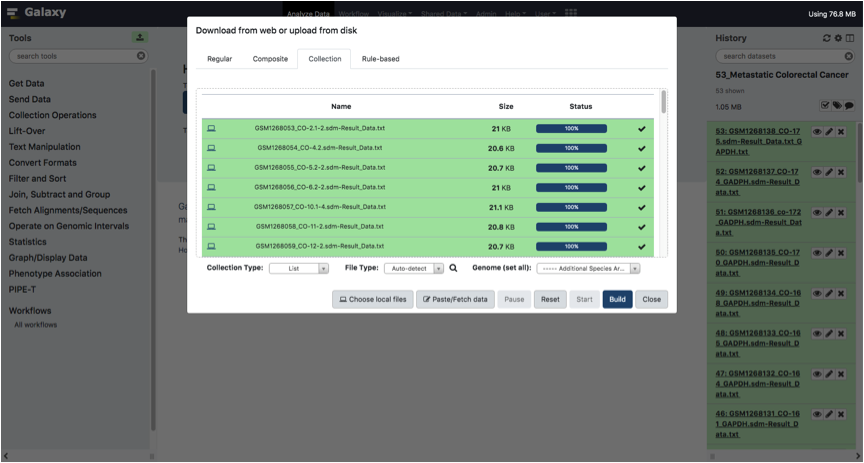
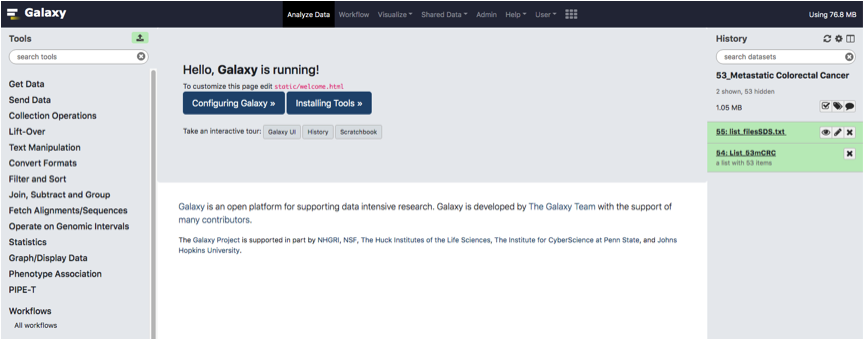
The first step is uploading the file to analyze. To this end, Click on the link Load your own data in the history tab on the right.
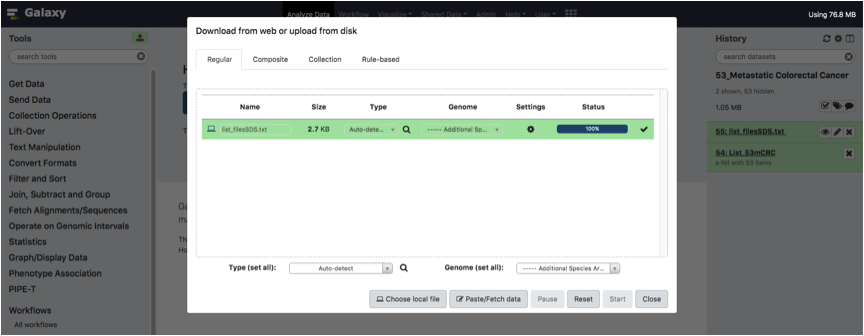
Galaxy will show a Uploading dashboard. Click on the Collection tab of the dashboard.
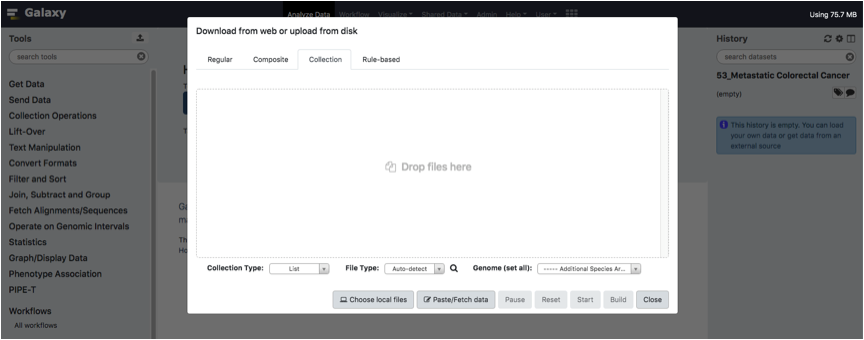
Upload your tab-separated text files (one per sample) and Click the Start button.
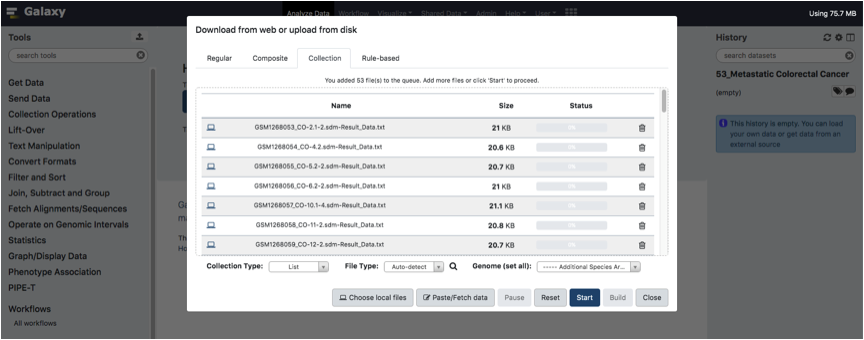
Wait until all files have been uploaded and click to the Build button.
In the bottom right text box, Type a name for the list collection and Click on the Create List button.
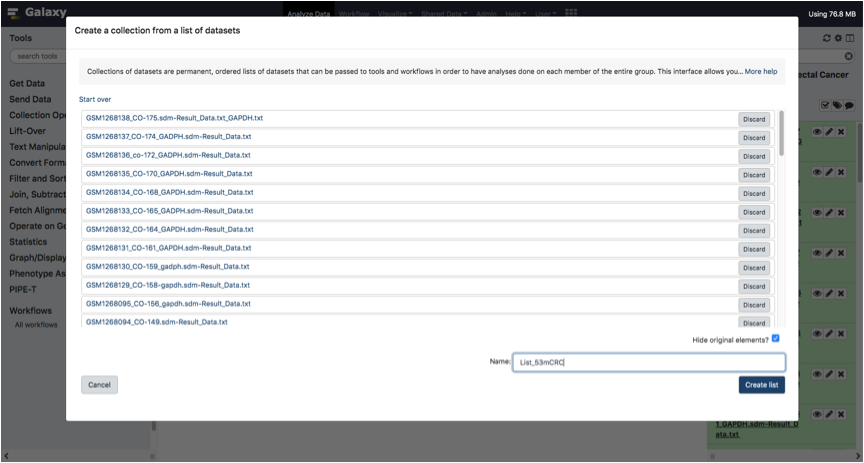
Congratulations! You created your ListOfFile.
Now we need to upload FileTrteatment. To do this, open the Upload tool as we did for ListOfFile, click on the regular tab.
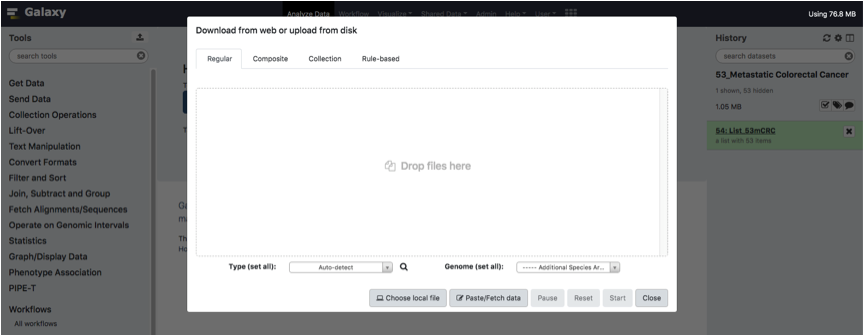
Upload your tab-separated text FileTreatment and Click on the Start Button.
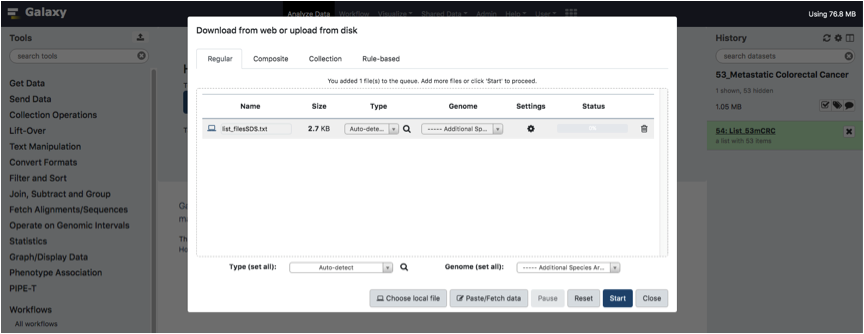
Wait until the file is fully loaded.
Congratulations! You are now ready to perform your analysis with PIPE-T.
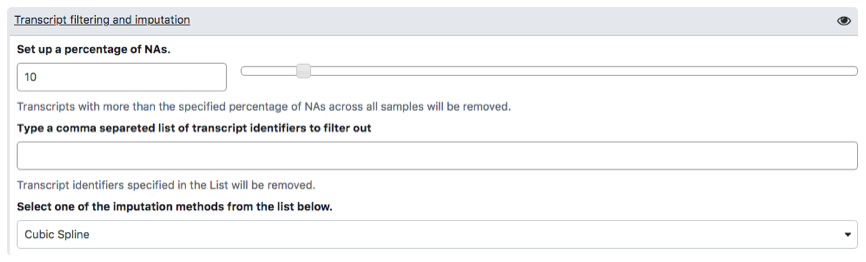
To carry out analysis with PIPE-T you need to set up a number of parameters. Some parameters are already configured by default, but you can change them. The following screenshots summarize the parameter settings of the analysis of the mCRC data. Analysis is relative to the files uploaded in the preceding section.
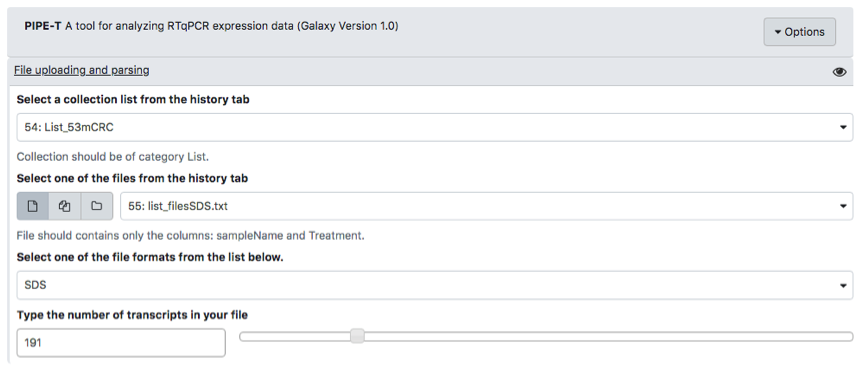
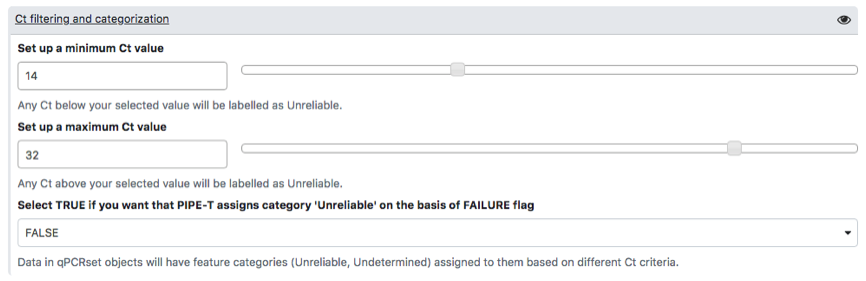
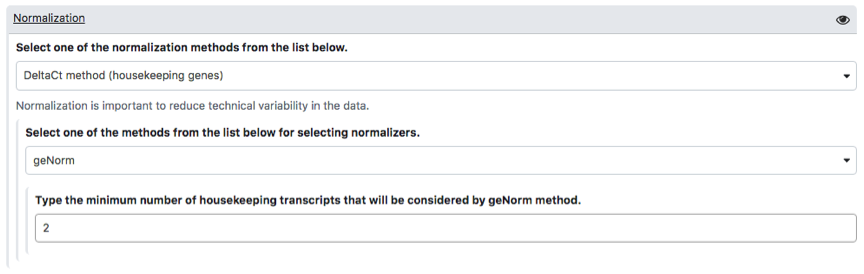
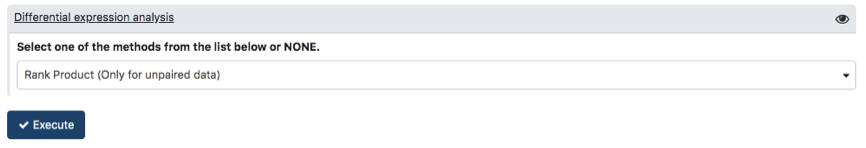
Click on Execute button to start analysis. When the execution ends, PIPE-T returns seven output files in the history tab in the right panel.
Here, we included the 7 output files returned by PIPE-T using the parameters set up in the preceding section.