To view the Responsive Power BI dashboard click here : https://app.powerbi.com/groups/me/reports/fb8e7d0e-71c7-4786-a8aa-645aff74b836/ReportSection
-
Let's say a company is facing isuues with thier Sales and as a Data Analyst or Data Scientist what insights can you pull out from the Sales data?
-
Firstly, you got to design a Strategy to tackle the problem. Usually Project Manager's use something called as AIMS Grid to project plan who all will be involved or bascially find out the relations to sort this issue for the company. https://www.coverdale.de/fileadmin/Germany/Toolbox/Aims-grid.pdf
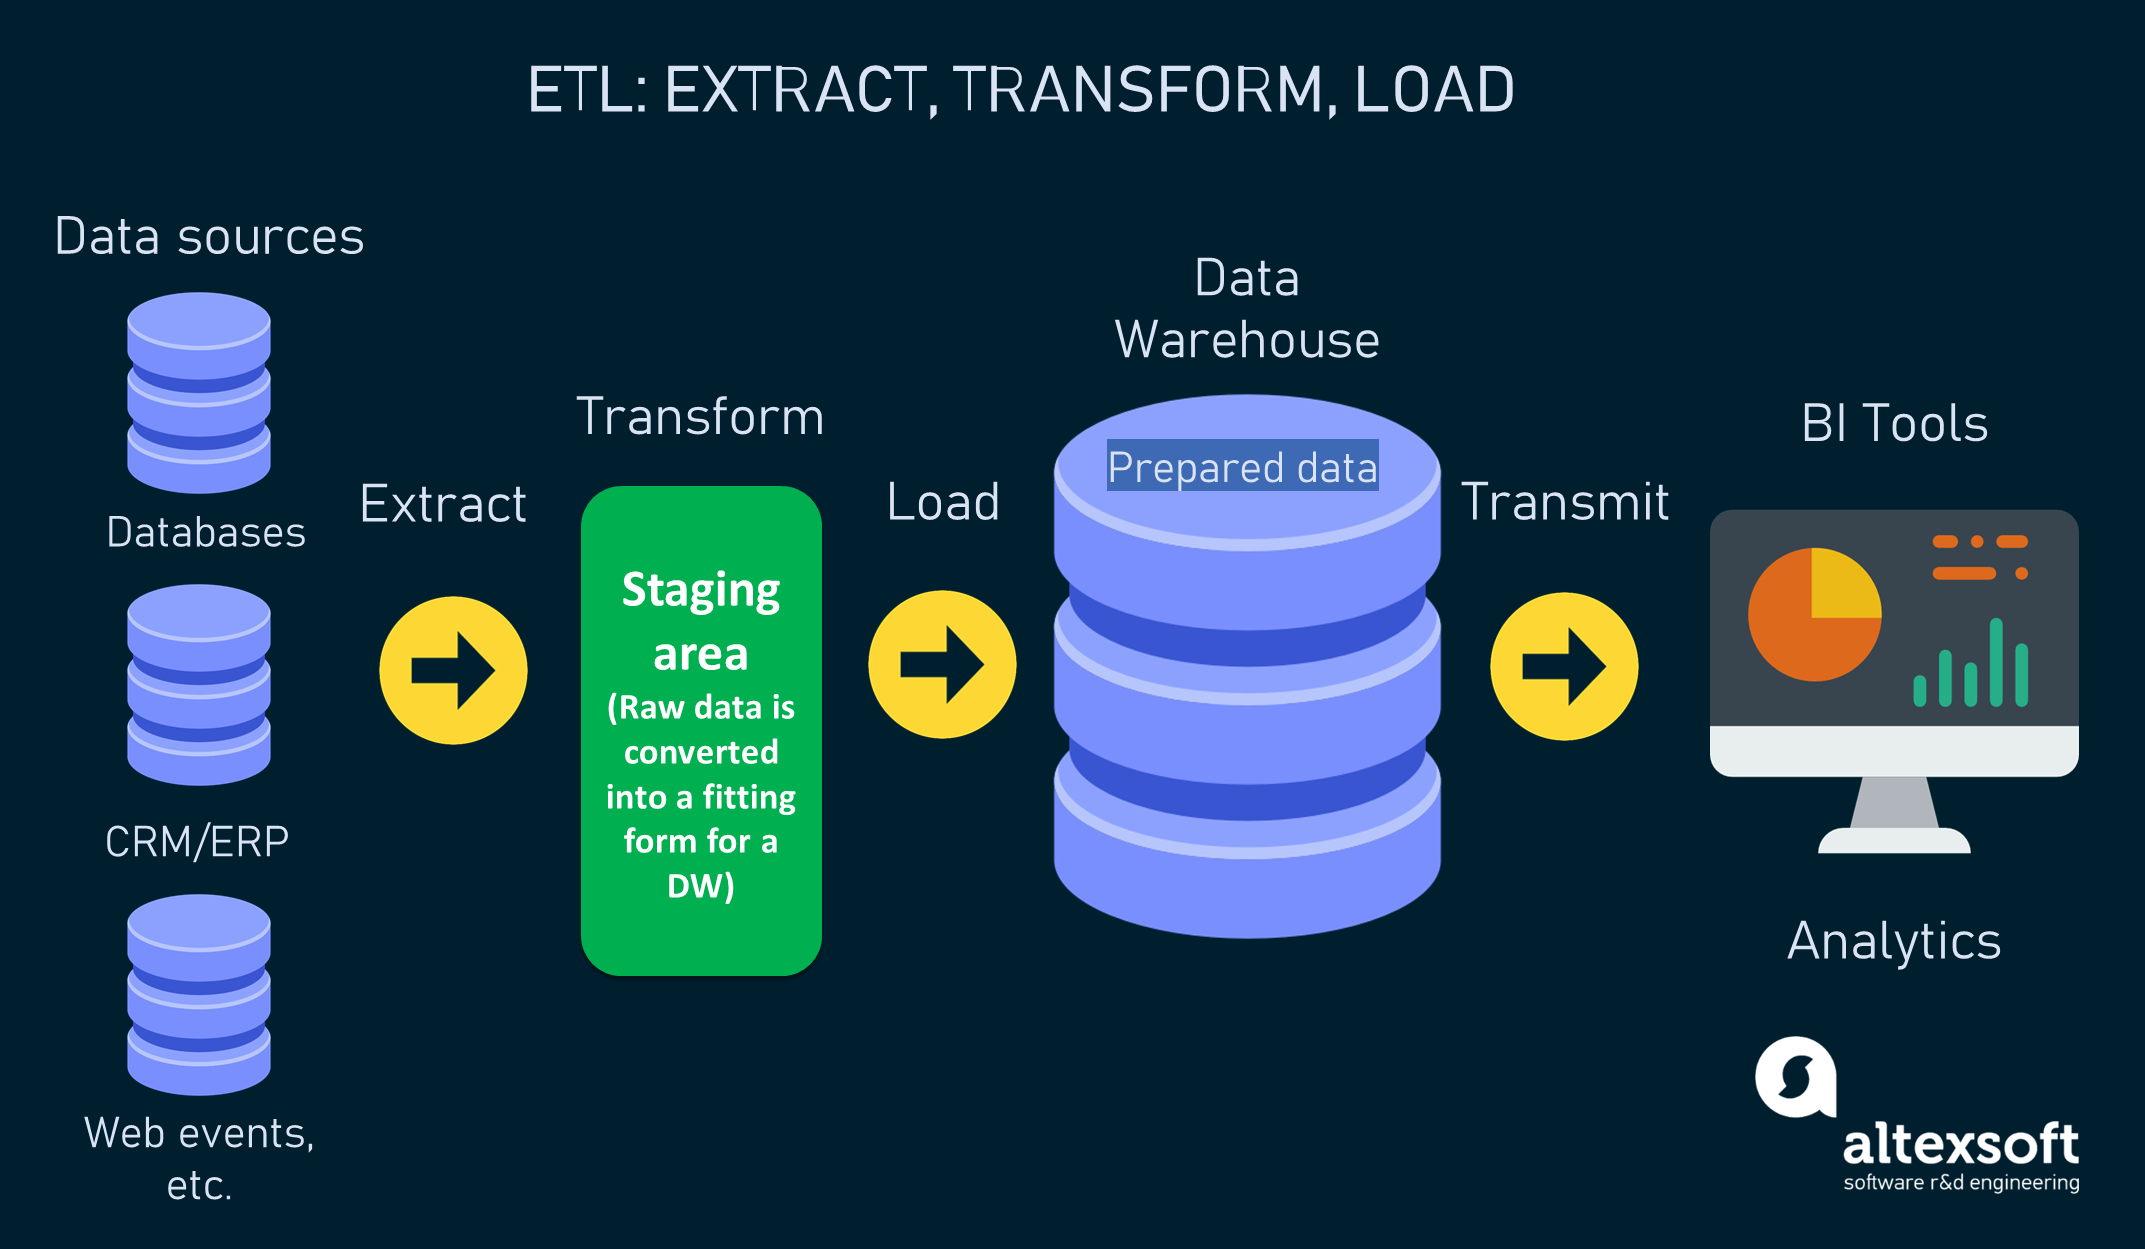
- Hence, we will execute ETL(Extract,Transform,Load) on MySQL and create a responsive dashboard in PowerBi and finally understand the business opportunities, patterns and trends within data via visualization graphs! This can be the Solution to the uplift the Companies Sales. Data Never Lies!!!
- Basic Knowledge about MySQL and Microsoft Power BI tools.
- Create an MySQL database in SSMS(MySQL Workbench) and load/extract the data from MySql Database.
- Usually in companies they create a "Data Warehouse" using ETL and from there follow with,
- Data Modelling - Data Cleaning - Data Transformation - Data Visualization and so on.
-
Create a simple dataflow in PowerBI Model. (You can also do it on VSCODE using SSIS integration).
-
Here, I''m following a Star Schema to Model,
-
You can learn more about Data Modelling if you follow this course, https://www.sqlbi.com/p/introduction-to-data-modeling-for-power-bi-video-course/
-
Also, to learn to create calculated columns, measures, and custom tables for Microsoft Power BI you can follow this DAX ( Data Analysis Expressions) course: https://www.sqlbi.com/p/introducing-dax-video-course/

- Now, apply necessary Transformations, (Very Similar to Data Preprocessing Steps in ML),
To know more on MySQL Syntax : https://www.w3schools.com/sql/sql_syntax.asp
-
To show all customer records
SELECT * FROM customers; -
To show total number of customers
SELECT count(*) FROM customers; -
To show transactions for Chennai market (market code for chennai is Mark001
SELECT * FROM transactions where market_code='Mark001'; -
To show distrinct product codes that were sold in chennai
SELECT distinct product_code FROM transactions where market_code='Mark001'; -
To show transactions where currency is US dollars
SELECT * from transactions where currency="USD" -
To show transactions in 2020 join by date table
SELECT transactions.*, date.* FROM transactions INNER JOIN date ON transactions.order_date=date.date where date.year=2020; -
To show total revenue in year 2020,
SELECT SUM(transactions.sales_amount) FROM transactions INNER JOIN date ON transactions.order_date=date.date where date.year=2020 and transactions.currency="INR\r" or transactions.currency="USD\r"; -
To show total revenue in year 2020, January Month,
SELECT SUM(transactions.sales_amount) FROM transactions INNER JOIN date ON transactions.order_date=date.date where date.year=2020 and and date.month_name="January" and (transactions.currency="INR\r" or transactions.currency="USD\r"); -
To show total revenue in year 2020 in Chennai
SELECT SUM(transactions.sales_amount) FROM transactions INNER JOIN date ON transactions.order_date=date.date where date.year=2020 and transactions.market_code="Mark001";
- Formula to create norm_amount column
= Table.AddColumn(#"Filtered Rows", "norm_amount", each if [currency] = "USD" or [currency] ="USD#(cr)" then [sales_amount]*75 else [sales_amount], type any)
- Formula for Revenue
Revenue = SUM('Sales transactions'[norm_sales_amount])
- Formula for Revenue Contribution percentage,
Revenue Contribution % = DIVIDE([Revenue],CALCULATE([Revenue],ALL('sales products'),ALL('sales customers'),ALL('sales markets')))


- You can clearly see that the company sales are dropping gradually, so, what suggestions as an analyst can we conclude? Well, It depends on many factors, which include,
- Product Quality,
- Advertising or Promotions,
- Healthy communications between Management and Suppliers,
- Product Aesthetics( Packaging!)
- Location based Demand
- Which particular market attracts the driving chain for those location-based market needs,
- Clearly, this company is more into the Retail Market so, Market is Dynamic, so it can be frequently changing...etc,
- Order Retention Rate(to find out the Re-order from our suppliers? Why has it been decreasing? Has the demand changed in the retail space for our products?)
- Some Suppliers might have generated huge Revenue for the company but the Profits Margins per product made to the company are low? Should we reconsider the contracts?
- Which Product lines are contributing to max profit margins? Who are those suppliers? Is your Selling Price per product is comparatively having more profit margins with your suppliers and suppliers-suppliers (Traders to End-Customers)

[Immanuvel Prathap's Website - Click Here!]