Skip to content
New issue

Have a question about this project? Sign up for a free GitHub account to open an issue and contact its maintainers and the community.

By clicking “Sign up for GitHub”, you agree to our terms of service and privacy statement. We’ll occasionally send you account related emails.

Already on GitHub? Sign in to your account

Add unpivot functionality #2539

Closed
sanderson opened this issue Feb 20, 2020 · 13 comments
Closed

Add unpivot functionality #2539

sanderson opened this issue Feb 20, 2020 · 13 comments
Assignees

Comments

@sanderson
Copy link
Contributor

sanderson commented Feb 20, 2020

Every now and then, I run into a use case where it would be really useful to have the ability to unpivot data. For example, I defined this custom minMaxMean() function that uses reduce() to output the min, max, and mean values for each table. The issue is that, as-is, I can't 1) visualize the results in the UI or 2) write them back to the db because the output schema doesn't meet the requirements for writing back into InfluxDB.

import "experimental"

minMaxMean = (tables=<-) =>
  tables
      |> reduce(
          identity: {count: 0, sum: 0.0, min: 0.0, max: 0.0, mean:0.0},
          fn: (r, accumulator) => ({ r with
            count: accumulator.count + 1,
            sum: r._value + accumulator.sum,
            min: if accumulator.count == 0 then r._value else if r._value < accumulator.min then r._value else accumulator.min,
            max: if accumulator.count == 0 then r._value else if r._value > accumulator.max then r._value else accumulator.max,
            mean: if accumulator.count == 0 then r._value else (r._value + accumulator.sum) / float(v: accumulator.count + 1)
          })
        )
      |> drop(columns: ["count", "sum"])

To accomplish those things, I have to create multiple filtered streams, then union them back together:

data = from(bucket: v.bucket)
  |> range(start: v.timeRangeStart, stop: v.timeRangeStop)
  |> filter(fn: (r) => r._measurement == "mem")
  |> filter(fn: (r) => r._field == "used_percent")
  |> window(every: v.windowPeriod)
  |> minMaxMean()
  |> duplicate(column: "_stop", as: "_time")
  |> window(every: inf)

min = data |> map(fn: (r) => ({r with _value: r.min, _metricType: "min"})) |> drop(columns: ["max", "mean"])
max = data |> map(fn: (r) => ({r with _value: r.max, _metricType: "max"})) |> drop(columns: ["min", "mean"])
mean = data |> map(fn: (r) => ({r with _value: r.mean, _metricType: "mean"})) |> drop(columns: ["min", "max"])

union(tables: [min, max, mean])
  |> experimental.group(columns: ["_metricType"], mode: "extend")

This could be simplified with an unpivot() function.

unpivot(
  columns: ["col1", "col2", "col3"],
  columnDst: "_metricType",
  valueDst: "_value"
)

So given the following input data:

_time col1 col2 col3
0001 val1.1 val2.1 val3.1
0002 val1.2 val2.2 val3.2
0003 val1.3 val2.3 val3.3

unpivot() would output:

_time _metricType _value
0001 col1 val1.1
0001 col2 val2.1
0001 col3 val3.1
0002 col1 val1.2
0002 col2 val2.2
0002 col3 val3.2
0003 col1 val1.3
0003 col2 val2.3
0003 col3 val3.3
@timhallinflux
Copy link
Contributor

Screen Shot 2020-04-25 at 11 39 48 AM

This would be incredibly useful in terms of quickly being able to render something like this.

@zegerhoogeboom
Copy link

This would be great. My use case to have this is doing a map to compute multiple values, something like

  |> map(fn: (r) => ({
    _time: r._time,
    foo: r.foo - r.baz,
    bar: r.bar - r.baz
}))

but needing the output to be in long format of having columns [_time, _field, _value].

@gefaila
Copy link

gefaila commented Aug 17, 2020

Un-pivot is definitely something I've needed in Flux. I've used the work-around but it's far from ideal.
+1 for this feature request.

@mirkodcomparetti
Copy link

THis will be useful for me as well!

@gefaila
Copy link

gefaila commented Mar 26, 2021

Please can we have unpivot! I've just spent hours on a workaround AGAIN where unpivot is exactly what's needed!

@jeroenvdm
Copy link

Currently, running into the same issue. Would be great to have an unpivot.

@jsternberg
Copy link
Contributor

jsternberg commented Apr 16, 2021

I'd like to hear a little bit more regarding times when unpivot is needed so we can make sure to design the function correctly. Some of the queries here could be rewritten slightly and avoid a need for an unpivot, but I'd like to hear feedback on them.

The query at the top of the issue:

data = from(bucket: v.bucket)
  |> range(start: v.timeRangeStart, stop: v.timeRangeStop)
  |> filter(fn: (r) => r._measurement == "mem")
  |> filter(fn: (r) => r._field == "used_percent")
  |> window(every: v.windowPeriod)
  |> minMaxMean()
  |> duplicate(column: "_stop", as: "_time")
  |> window(every: inf)

min = data |> map(fn: (r) => ({r with _value: r.min, _metricType: "min"})) |> drop(columns: ["max", "mean"])
max = data |> map(fn: (r) => ({r with _value: r.max, _metricType: "max"})) |> drop(columns: ["min", "mean"])
mean = data |> map(fn: (r) => ({r with _value: r.mean, _metricType: "mean"})) |> drop(columns: ["min", "max"])

union(tables: [min, max, mean])
  |> experimental.group(columns: ["_metricType"], mode: "extend")

This would be more efficiently written like this:

data = from(bucket: v.bucket)
  |> range(start: v.timeRangeStart, stop: v.timeRangeStop)
  |> filter(fn: (r) => r._measurement == "mem")
  |> filter(fn: (r) => r._field == "used_percent")

aggregate = (tables=<-, name, fn) => tables
    |> aggregateWindow(fn: fn, every: v.windowPeriod, createEmpty: false)
    |> map(fn: (r) => ({r with _metricType: name}))
    |> experimental.group(columns: ["_metricType"], mode: "extend")

datamin = data |> aggregate(name: "min", fn: min)
datamax = data |> aggregate(name: "max", fn: max)
datamean = data |> aggregate(name: "mean", fn: mean)

union(tables: [min, max, mean])

I don't have the entire query, but I think that the other example is pretty similar:

|> map(fn: (r) => ({
    _time: r._time,
    foo: r.foo - r.baz,
    bar: r.bar - r.baz
}))

Could be rewritten to two map calls.

data = ...

first = data |> map(fn: (r) => ({_time: r._time, _field: "foo", _value: r.foo - r.baz}))
second = data |>  map(fn: (r) => ({_time: r._time, _field: "bar", _value: r.bar - r.baz}))
union(tables: [first, second])

But, I am not sure that these methods are very user-friendly and we want to make this very obvious for new flux developers. It seems that there might be two aggravating factors.

  1. The union() at the end seems a bit unintuitive and annoying. I have to save each of the branches to a variable and then explicitly call union before I yield it. This isn't obvious and I wonder if, had the union just been implicit, if it would have been easier to recognize that this was an easy way to get the result.
  2. Sometimes, flux will need to interact with data from another source and so sometimes we'll have to manipulate data in a way that's not ideal. I imagine there's some situations, such as the influxdb monitoring packages, where there's less of a choice for whether you are working with already pivoted data. For these needs, I think we still need to have the opposite functionality.

For 2, I think this issue captures the need. I have to take a row and split it into multiple rows that could go into different table keys. The reason why this isn't ideal is because I don't think we would be able to keep type information and I suspect it would be harder for us to parallelize the query to increase performance with this method. The above methods would allow the mean, max, and min to be processed concurrently by the engine. It also makes it easier for the planner to recognize that it could convert the above into pushdowns while the reduce() method is more difficult for us to determine that it is implementing a pushdown without having a smarter optimizer than we presently have.

For 1, I am wondering if it would help if yield() did this by default. At the moment, yield() will error if it is included twice in a query. I wonder if yield() would be easier to use if it also included an implicit union when it was used instead of erroring. Then, in the first example, I could do this:

data = from(bucket: v.bucket)
  |> range(start: v.timeRangeStart, stop: v.timeRangeStop)
  |> filter(fn: (r) => r._measurement == "mem")
  |> filter(fn: (r) => r._field == "used_percent")

aggregate = (tables=<-, name, fn) => tables
    |> aggregateWindow(fn: fn, every: v.windowPeriod, createEmpty: false)
    |> map(fn: (r) => ({r with _metricType: name}))

data |> aggregate(name: "min", fn: min)
data |> aggregate(name: "max", fn: max)
data |> aggregate(name: "mean", fn: mean)

We're going to have a wider team discussion today so I am just brainstorming possible ideas.

@thopewell
Copy link

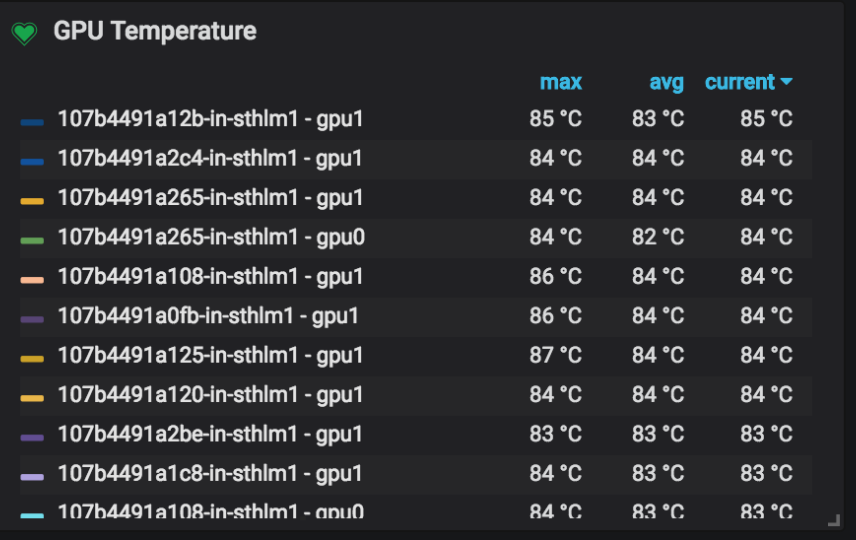
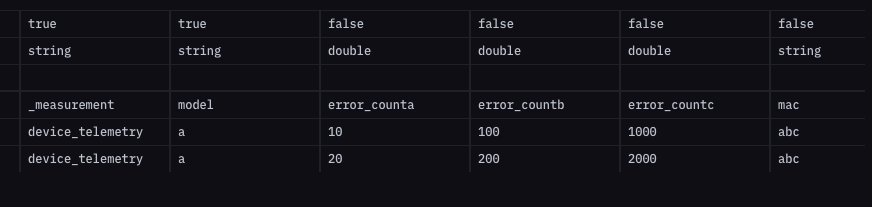
I'm looking for something similar to unpivot, but to be honest, I think I might be working around a cardinality issue (looking forward to Influx IOx).

I'm collecting telemetry from devices. Its natural to use "mac address" as a tag, but we quickly hit cardinality limits in Influx cloud and moved mac address to a field. An approximation of my data in line protocol is:

telemetry,model=a error_counta=10,error_countb=100,error_countc=1000,mac="abc" 1623429000
telemetry,model=a error_counta=1,error_countb=1,error_countc=1,mac="def" 1623429000=1
telemetry,model=a error_counta=20,error_countb=200,error_countc=2000,mac="abc" 1623429300
telemetry,model=a error_counta=2,error_countb=2,error_countc=2,mac="def" 1623429301

We're using Grafana to visualize this data both for the population and for individual devices.
My query for an individual device:

from(bucket: "test-bucket")
  |> range(start: v.timeRangeStart, stop: v.timeRangeStop)
  |> filter(fn: (r) => r["_measurement"] == "device_telemetry")
  |> filter(fn: (r) => r["_field"] =~ /error/ or r["_field"] == "mac")
  |> pivot(rowKey:["_time"], columnKey: ["_field"], valueColumn: "_value")
  |> filter(fn: (r) => r["mac"] =~ /abc/)

Which results in:
image

I'm lazy and when we introduce error_countd, I don't want to have to update any dashboards.
If it were possible to unpivot the above so that each column name becomes a value under "_field", and the value is mapped to "_value", my use case would be satisfied.

I made some progress using the above - which is a useful pattern for many other queries I have so thanks for that - but it doesn't quite get me to the end state I need:

data = from(bucket: "test-bucket")
  |> range(start: v.timeRangeStart, stop: v.timeRangeStop)
  |> filter(fn: (r) => r["_measurement"] == "device_telemetry")
  |> filter(fn: (r) => r["_field"] =~ /error/ or r["_field"] == "mac")
  |> pivot(rowKey:["_time"], columnKey: ["_field"], valueColumn: "_value")
  |> filter(fn: (r) => r["mac"] =~ /abc/)

aggregate = (tables=<-, mycolumn) => tables
    |> aggregateWindow(fn: mean, every: 5m, column: mycolumn, createEmpty: false)
    // this doesn't throw an error but doesn't work.  Also tried rename()
    // |> map(fn: (r) => ({r with "_field": mycolumn, "_value": r.mycolumn}))
    |> map(fn: (r) => ({r with "_field": mycolumn}))

error_counta = data |> aggregate(mycolumn: "error_counta")
error_countb = data |> aggregate(mycolumn: "error_countb")
union(tables: [error_counta, error_countb])
  |> group(columns:["_field"])

I have a post about this in the Influx community too: https://community.influxdata.com/t/lazy-grafana-dashboarding-using-field-vs-tag/19309

@achang1114
Copy link

I'd also like an unpivot() function. My use case is that I'm trying to count the unique occurrences of different values within arrays that are stored in my _values column.

_time _value
2020-01-01 00:00:00 [4007 0 0 0 0 0]
2020-01-01 00:01:00 [0 0 0 0 0 0]
2020-01-01 00:02:00 [6021 6021 6021 6021 6021 6021]

The only way that I know how to parse these results is to use strings.split(), which puts the results into individual columns:

import "experimental/array"
import "strings"

data = array.from(rows: [
  {_time: 2020-01-01T00:00:00Z, _field: "ErrorNumber", _value: "[4007 0 0 0 0 0]"},
  {_time: 2020-01-01T00:01:00Z, _field: "ErrorNumber", _value: "[0 0 0 0 0 0]"},
  {_time: 2020-01-01T00:02:00Z, _field: "ErrorNumber", _value: "[6021 6021 6021 6021 6021 6021]"}
])
    // Remove brackets
    |> map(fn: (r) => {
        ErrorNumberArray1 = strings.replace(v: r._value, t: "[", u: "", i: 2)
        ErrorNumberArray2 = strings.replace(v: ErrorNumberArray1, t: "]", u: "", i: 2)
        return {_time: r._time,
            _field: r._field,
            _value: ErrorNumberArray2}
    })

    // Split _value into individual columns
    |> map(fn: (r) => {
        Array = strings.split(v: r._value, t: " ")
        return {
            _time: r._time,
            SegNum0: Array [0],
            SegNum1: Array [1],
            SegNum2: Array [2],
            SegNum3: Array [3],
            SegNum4: Array [4],
            SegNum5: Array [5]
        }
    })

// Split into multiple datasets
SegNum0 = data
    |> keep(columns: ["_time","SegNum0"])
    |> rename(columns: {SegNum0: "ErrorNum"})
    |> set(key: "SegNum", value: "SegNum0")
SegNum1 = data
    |> keep(columns: ["_time","SegNum1"])
    |> rename(columns: {SegNum1: "ErrorNum"})
    |> set(key: "SegNum", value: "SegNum1")
SegNum2 = data
    |> keep(columns: ["_time","SegNum2"])
    |> rename(columns: {SegNum2: "ErrorNum"})
    |> set(key: "SegNum", value: "SegNum2")
SegNum3 = data
    |> keep(columns: ["_time","SegNum3"])
    |> rename(columns: {SegNum3: "ErrorNum"})
    |> set(key: "SegNum", value: "SegNum3")
SegNum4 = data
    |> keep(columns: ["_time","SegNum4"])
    |> rename(columns: {SegNum4: "ErrorNum"})
    |> set(key: "SegNum", value: "SegNum4")
SegNum5 = data
    |> keep(columns: ["_time","SegNum5"])
    |> rename(columns: {SegNum5: "ErrorNum"})
    |> set(key: "SegNum", value: "SegNum5")

// Union all datasets
union(tables: [SegNum0, SegNum1, SegNum2, SegNum3, SegNum4, SegNum5])
    |> group(columns: ["ErrorNum"])
    |> count(column: "SegNum")
    |> rename(columns: {SegNum: "Count"})

In this example, the array is only 6 elements long, but my actual data has 100 elements, and the code quickly gets out of hand with repeating sections. There also seems to be a performance impact, I'm guessing because I'm creating so many tables.

I'm hoping this could be significantly simplified by including an unpivot() function, hopefully with a performance boost as well. I'll still have repeating code in the split() section, but I'll save in the table definitions and union sections:

import "experimental/array"
import "strings"

data = array.from(rows: [
  {_time: 2020-01-01T00:00:00Z, _field: "ErrorNumber", _value: "[4007 0 0 0 0 0]"},
  {_time: 2020-01-01T00:01:00Z, _field: "ErrorNumber", _value: "[0 0 0 0 0 0]"},
  {_time: 2020-01-01T00:02:00Z, _field: "ErrorNumber", _value: "[6021 6021 6021 6021 6021 6021]"}
])
    // Remove brackets
    |> map(fn: (r) => {
        ErrorNumberArray1 = strings.replace(v: r._value, t: "[", u: "", i: 2)
        ErrorNumberArray2 = strings.replace(v: ErrorNumberArray1, t: "]", u: "", i: 2)
        return {_time: r._time,
            _field: r._field,
            _value: ErrorNumberArray2}
    })

    // Split _value into individual columns
    |> map(fn: (r) => {
        Array = strings.split(v: r._value, t: " ")
        return {
            _time: r._time,
            SegNum0: Array [0],
            SegNum1: Array [1],
            SegNum2: Array [2],
            SegNum3: Array [3],
            SegNum4: Array [4],
            SegNum5: Array [5]
        }
    })

    // Unpivot
    |> group(columns: ["_time"])
    |> unpivot(key: "SegNum", value: "ErrorNum")
    |> group(columns: ["ErrorNum"])
    |> count(column: "SegNum")
    |> rename(columns: {SegNum: "Count"})

@nathanielc nathanielc removed the Epic label Mar 3, 2022
@mjeanrichard
Copy link

@jsternberg Is there any update on this? I think you misunderstood the exmaple from @zegerhoogeboom. I have a similar situation.

from(bucket: "myBucket")
  |> range(start: v.timeRangeStart, stop: v.timeRangeStop)
  |> filter(fn: (r) => r["_field"] == "A" or r["_field"] == "B" or r["_field"] == "C")
  |> aggregateWindow(every: 1d, fn: sum, createEmpty: false)
  |> pivot(rowKey: ["_time"], columnKey: ["_field"], valueColumn: "_value")
  |> map(fn: (r) => ({ r with X: r.A + r.B }))

Then I would like to store that daily aggregate back to a new bucket. But I can't because now there is no _field colum. I would have to unpivot to be able to do this.
Is there a workaround for this scenario?

@sanderson
Copy link
Contributor Author

@mjeanrichard you can use experimental.to() to write pivoted data to InfluxDB. This is what it’s designed for.

@blueforesticarus
Copy link

Why doesn't readding the _value column with map work as expected??

@sanderson
Copy link
Contributor Author

unpivot() is available in the standard library as an experimental function. Closing this issue.

@gefaila
Copy link

gefaila commented Nov 10, 2022 via email

Sign up for free to join this conversation on GitHub. Already have an account? Sign in to comment
Projects
None yet
Development

No branches or pull requests