This is a tutorial to build a very simple web app with iobio. If you want to skip to the end and see the finished product click here. This tutorial will include
- Grabbing some genomic data using iobio.js and websockets
- Visualizing the data using iobio.viz
- Customizing the visualization using iobio.viz and d3
We will be making use of a few iobio libraries including:
iobio.js- create commands and handle websocket creation and returning dataiobio.viz- visualization library that handles streaming data
To learn more about these libraries go to there home pages linked above.
For all steps you'll be working in the working directory. But each step below has a directory in this repo, so if things go wrong somewhere along the way you can simply copy the example file (e.g. app.step2.html) to get back on track.
Step 1 - Create UI For Data Selection
Step 2 - Create iobio Command
Step 3 - Create Visualization
Step 4 - Hook Up Data to Visualization
Step 5 - Improve visualization
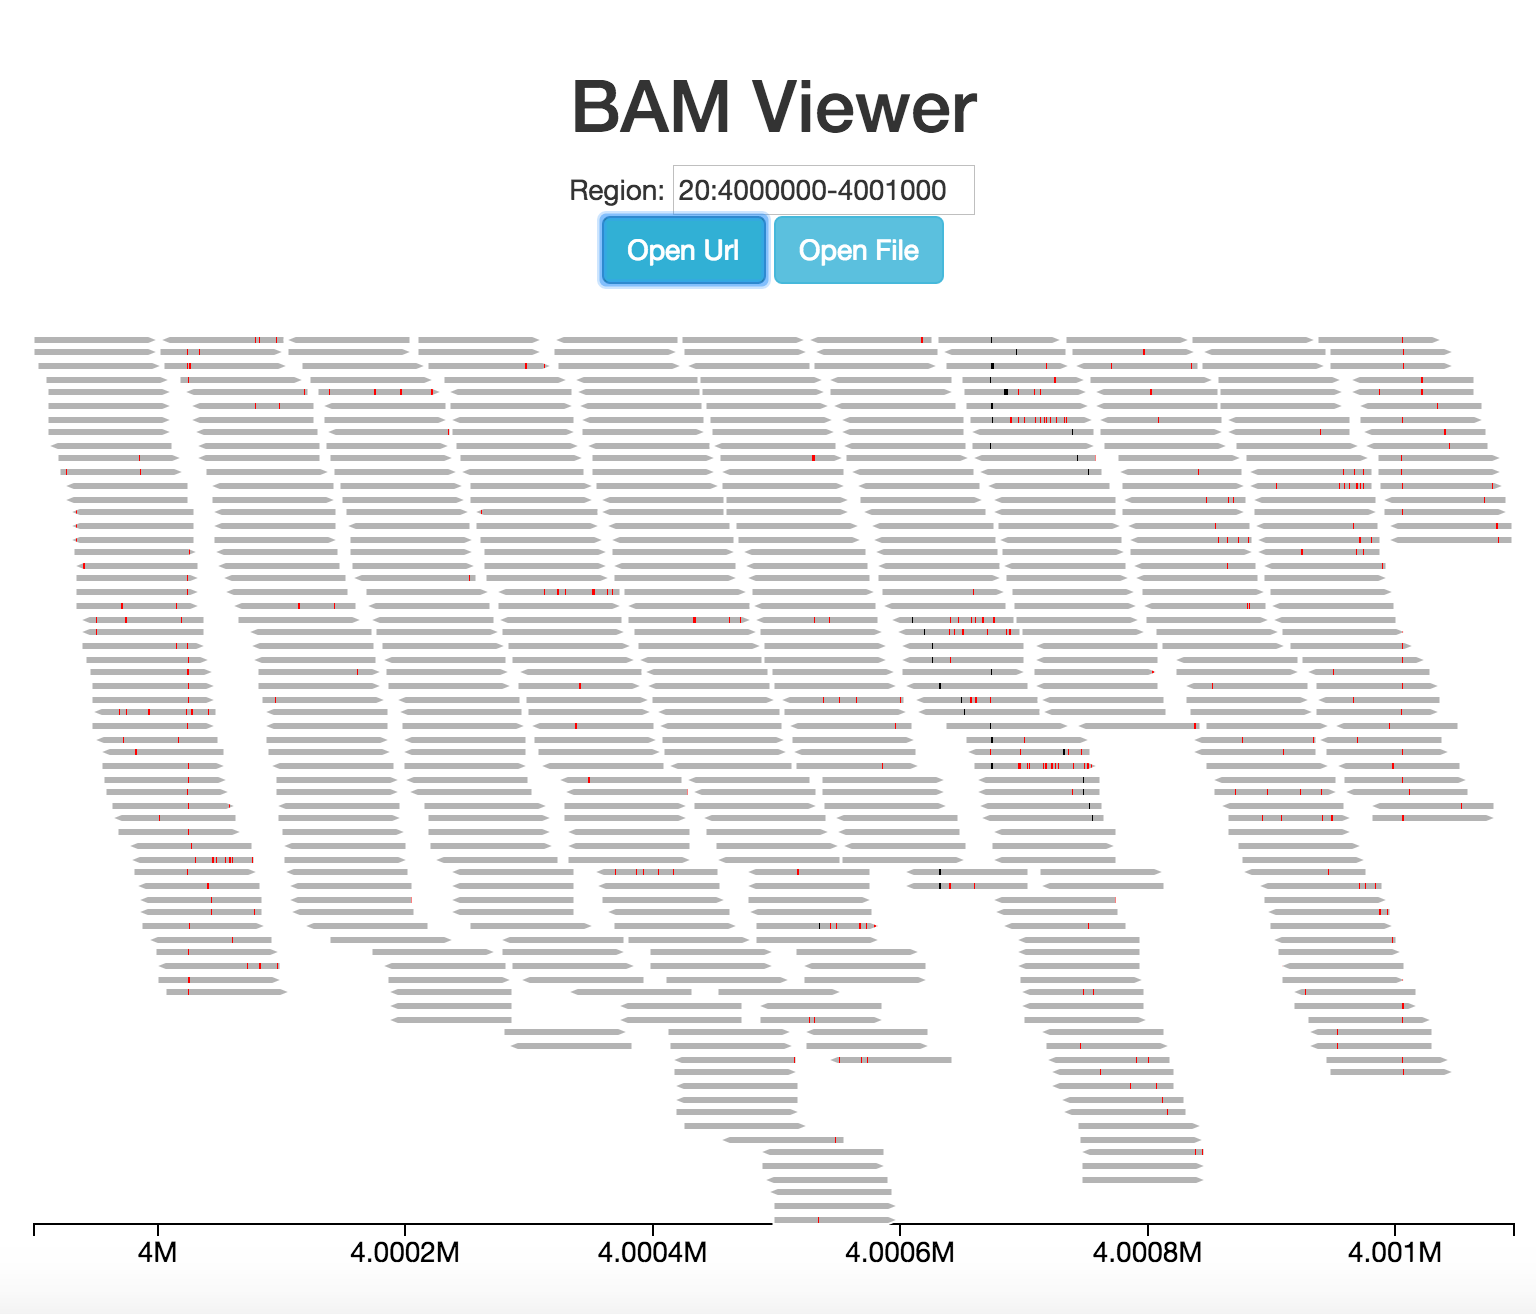
One of the defining characteristics of iobio is its streaming nature. The visualization we've created (and all iobio.viz visualizations) can handle streaming data by default. To see this in action test a bigger region like this 20:4000000-4009000. This looks especially nice using the app.step4.html file, which has lots of colors.