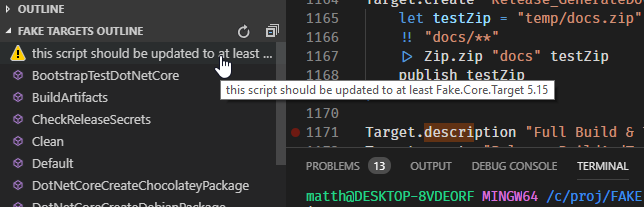
Fake target support -> 4 0 #1137
Conversation
|
This requires ionide/ionide-vscode-helpers#29 (therefore the build is red) (I'd recommend adding those vscode-helpers as git subtree instead of paket dependencies. I actually edited them and didn't realize they are not even under source control) |
This comment has been minimized.
This comment has been minimized.
|
I think this ready for review, seems to work. |
|
Not sure why the build is red, can someone help? While further testing I noticed the following (which is currently by design). If navigation doesn't work the likely reason is that |
|
Also note that navigation should work no matter which DSL you are using as long as it is backed by |
|
I think navigation into targets defined in a |
| cwd = scriptDir | ||
| console = "externalTerminal" | ||
| stopAtEntry = false | ||
| justMyCode = false |
There was a problem hiding this comment.
I'm not sure why we need to deactivate this or what "my Code" means here. If I set this to true no breakpoint hits.
How can I tell the debugger that the current file is "my code"? Anyone understands the details here?
The problem with false is that you can see all the stack from the FAKE runtime and potentially unrelated stuff...
There was a problem hiding this comment.
Can someone please ping someone who knows something?
There was a problem hiding this comment.
I believe this is exactly the same as Just My Code in VS - https://docs.microsoft.com/en-us/visualstudio/debugger/just-my-code?view=vs-2019
There was a problem hiding this comment.
The .NET Framework debugger considers optimized binaries and non-loaded .pdb files to be non-user code.
Three compiler attributes also affect what the .NET debugger considers to be user code:DebuggerNonUserCodeAttribute tells the debugger that the code it's applied to isn't user code.
DebuggerHiddenAttribute hides the code from the debugger, even if Just My Code is turned off.
DebuggerStepThroughAttribute tells the debugger to step through the code it's applied to, rather than step into the code.The .NET Framework debugger considers all other code to be user code.
Ok none of these attributes was set but I saw in the debug output:
Not loading <compiledDll_hash>.pdb because just my code is enabled.
So the debugger is not loading the pdb because just my code is enabled and it considers the dll not 'my code' because no pdb is loaded? Circle reasoning? I'm sure the dll has --optimize- enabled
There was a problem hiding this comment.
Should we ignore this for now and note as "known limitation"? To be honest, I have no idea what to do.
Just unfortunate that the experience is a bit unfortunate... At least it works.
|
Ok it now looks like this: I took the icons from https://github.com/microsoft/vscode/tree/master/src/vs/base/browser/ui/dialog, not sure if this OK, probably not. Ideas? |
|
Ideally, we would add Icons for "soft" and "hard" dependencies as well... |
* smaller fixes

* implement outline for fake targets

* remove logging

* Give FSAC some context

* fix languageserver implementation (based on 4.0)

* add logger and use fsharp/fakeTargets instead

* simplify package.json

* Remove FakeRuntimePath and add support for running and debugging targets

* cleanup

* update ionide-vscode-helper files

* use new error information from fsac and add them on top of the outline

* fix error messages.

* Just to be safe use --nocache when debugging as well.
Replaces #1136
This depends on ionide/FsAutoComplete#415 and ionide/ionide-vscode-helpers#29
(ignore the typo in the screenshot)