Conprof is a continuous profiling project. Continuous profiling is the act of taking profiles of programs in a systematic way. Conprof collects, stores and makes profiles available to be queried over time.
Conprof features:
- A multi-dimensional data model (series of profiles are identified by their type and set of key/value dimensions)
- A query language to explore profiles over time
- No dependency on distributed storage; single server nodes are autonomous
- A HTTP pull model, that scrapes profiles from processes and stores it in its database
- Targets are discovered via service discovery or static configuration
Have you ever been in the situation where you know your application has a memory leak and was OOMKilled, but you of course don't have the memory profile from right before that happened? Or you experienced a latency spike in your application and you wish you had a CPU profile from exactly that point in time, but don't have it? This is why continuous profiling is important, it allows answering these questions even in retrospect, without going on a search for the needle in the haystack after the fact.
Conprof is most useful when paired with a metrics system such as Prometheus, as Prometheus can be used to identify a situation based on metrics and Conprof can be used to investigate the particular situation.
To continuously profile an application with Conprof, it must expose HTTP endpoints that when requested, return pprof compatible profiles. Instrumenting your application is a one time thing, and only takes a few lines of code, find out how to instrument your application.
For demonstration purposes this guide uses the pprof-example-app-go project, using the pre-built container image available:
docker run --network host --rm -it quay.io/polarsignals/pprof-example-app-go:v0.1.0This app calculates large fibonacci numbers, so a bunch of numbers will be printed on the terminal.
Next we start Conprof using docker and scrape profiles from the pprof-example-app-go.
Here we're using the master-2021-02-15-56c07ca tag, but choose the version you want to use from the container image repo:
docker run --network host --rm -it -v /etc/passwd:/etc/passwd -u `id -u`:`id -g` -v `pwd`:`pwd`:z -w `pwd` quay.io/conprof/conprof:master-2021-02-15-56c07ca all --config.file examples/pprof-example-app-go.yaml --http-address :10902 --storage.tsdb.path ./dataOpen http://localhost:10902/ and write a query like heap{job="pprof-example-app-go"} which displays results on a timeline.
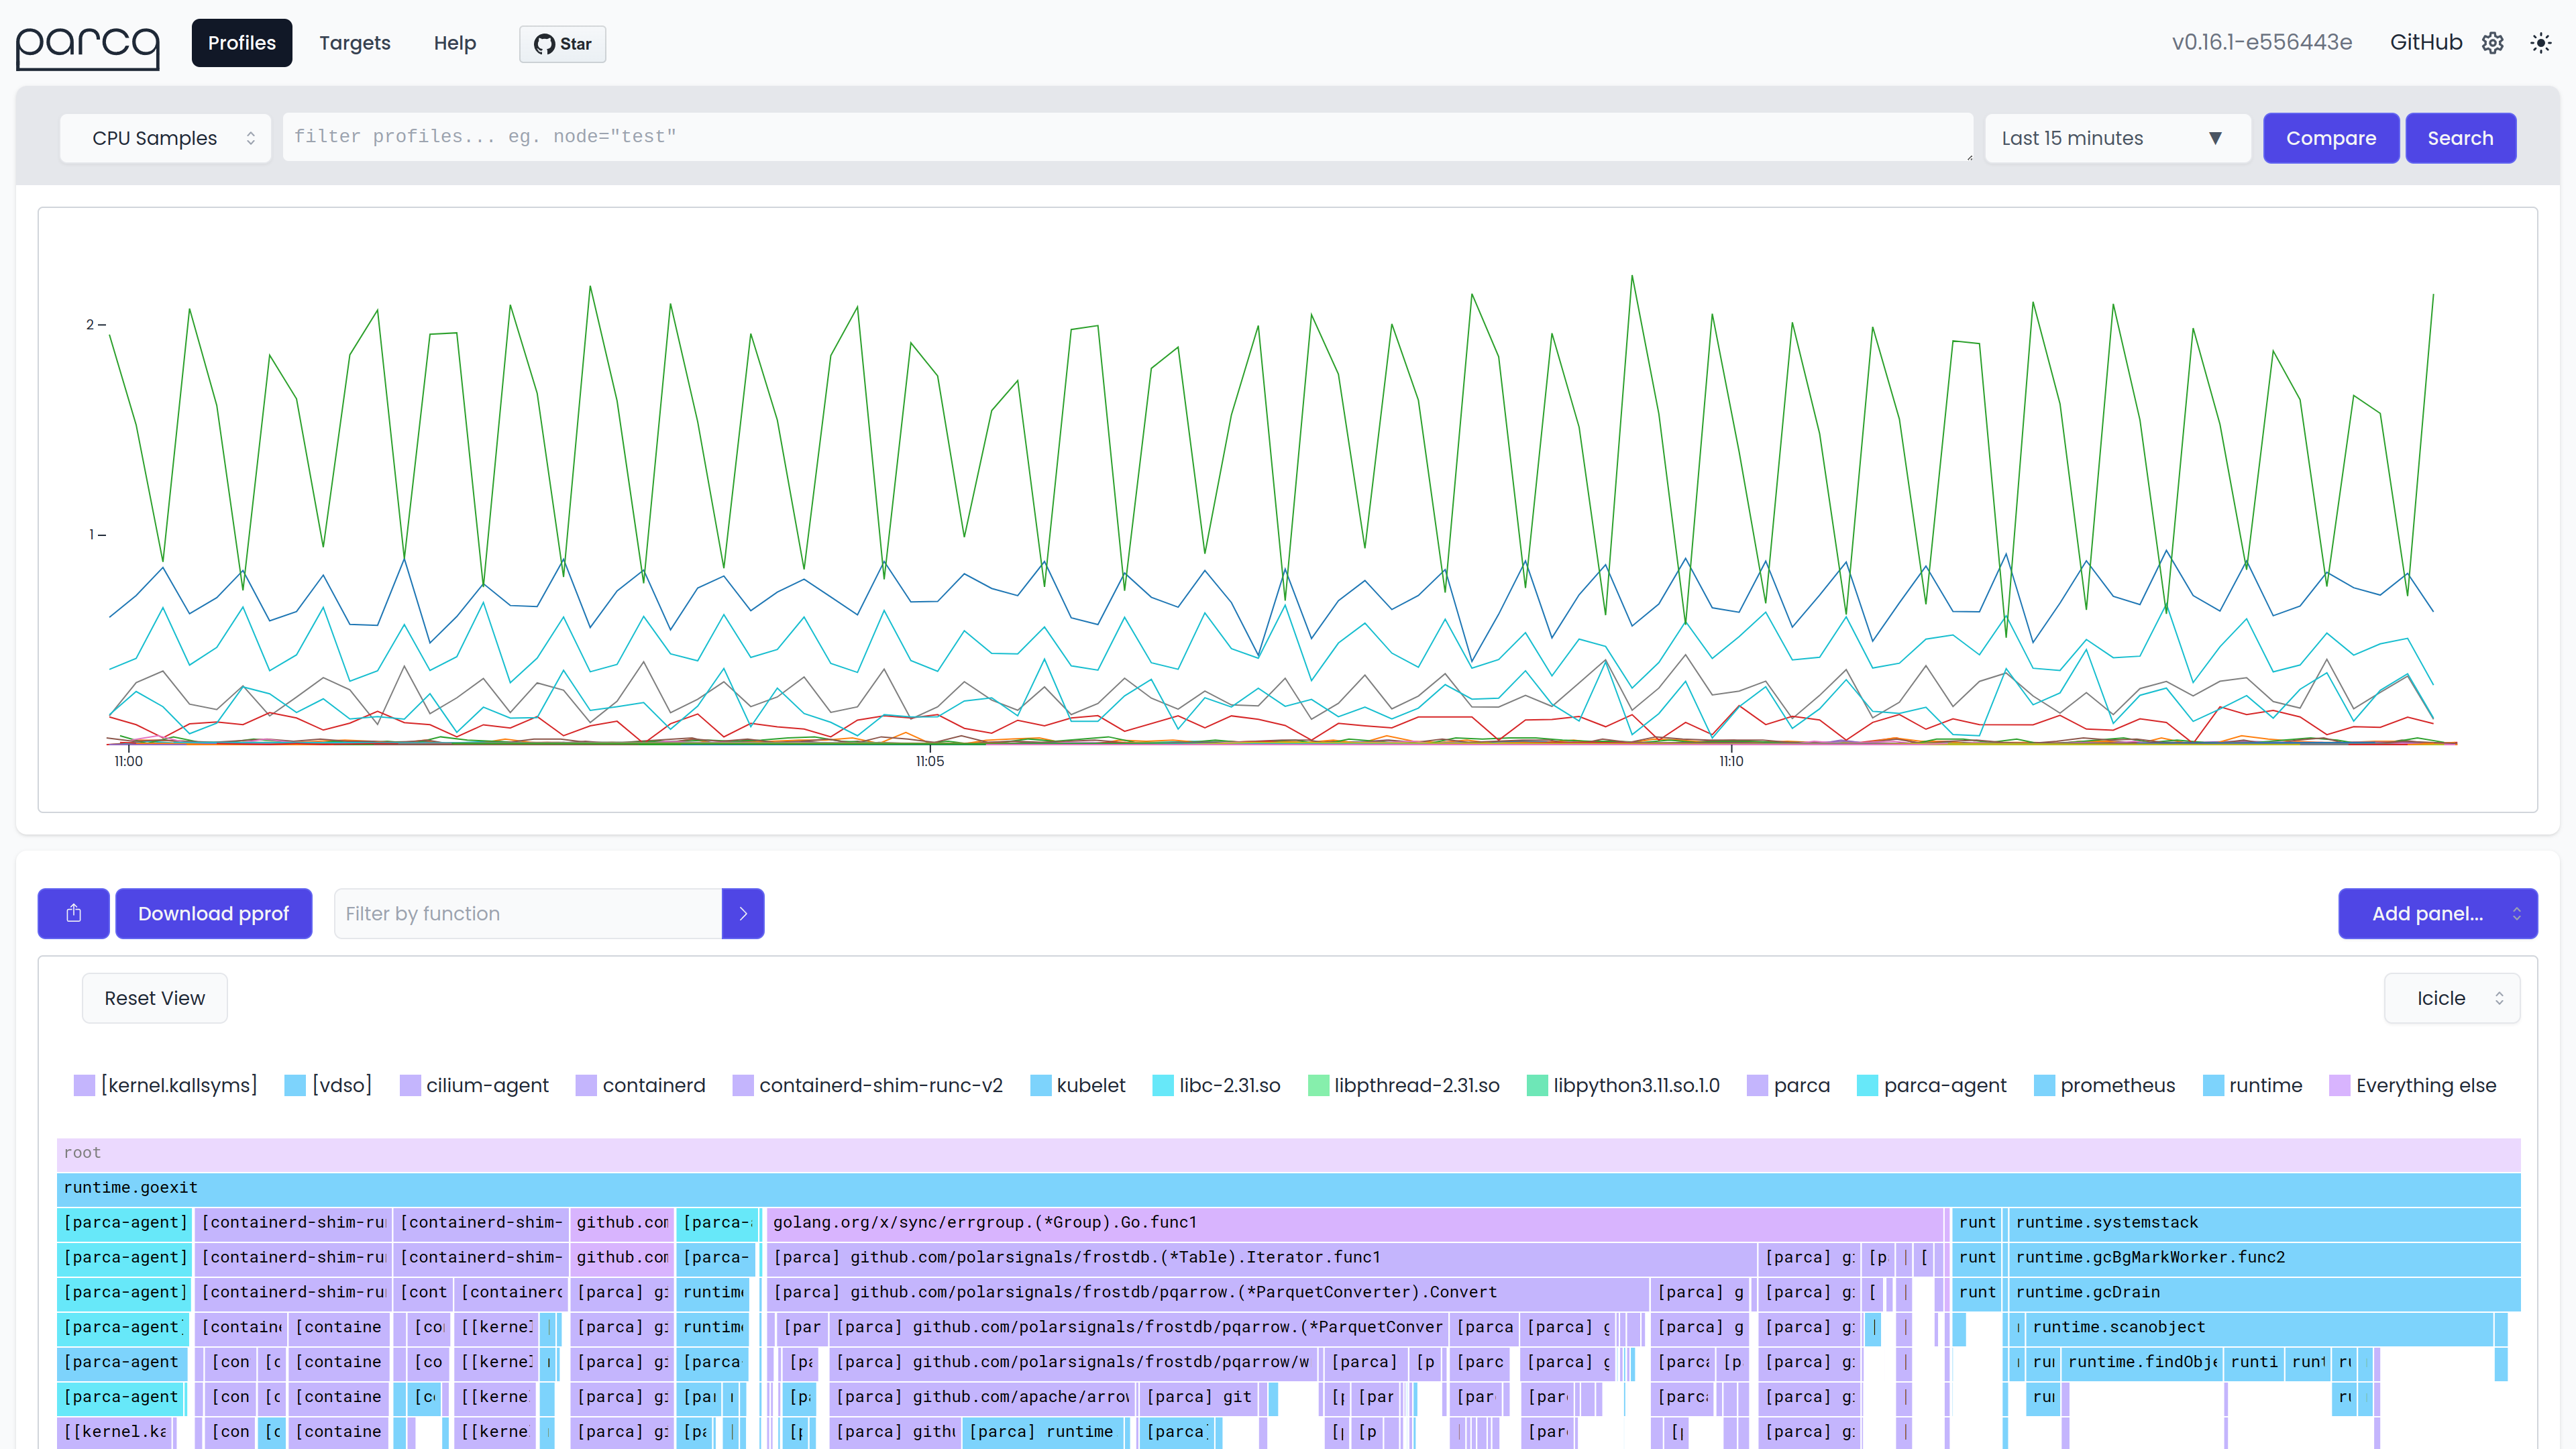
Here's a screenshot of what that might look like after a few minutes of running.
When clicking on a sample the pprof UI included in the pprof toolchain, will be opened. An example could be:
You can also build the conprof binary yourself from the root of the repo directory:
git clone git@github.com:conprof/conprof.git
GO111MODULE=on GOPROXY=https://proxy.golang.org go install -v
Running the getting started example with the binary you built:
conprof all --config.file examples/conprof.yaml --http-address :10902 --storage.tsdb.path ./data- Run
npm installandnpm run buildonce in the web directory. - Run
make assetsto inline the assets into a go file. - Run
make conprofto build the app.
Note: For UI development you can run npm start in the web directory and it will proxy requests to the backend.
Refer to CONTRIBUTING.md.
Apache License 2.0, see LICENSE.
If this sounds a lot like Prometheus, then that's no accident. The initial creator of Conprof ( @brancz ) is also a Prometheus maintainer. Conprof is based on a lot of principles and even code of Prometheus, the service discovery mechanism and configuration works very similar to Prometheus and the general functionality is similar, as consecutive profiles of the same type and the same process behave similar to time-series, as in that they are related events of the same origin thus they are in the same series. Only that sample values in Conprof are not float64, but an arbitrary byte array.
Additionally, Google has written about continuous profiling in their whitepaper: Google-Wide Profiling: A Continuous Profiling Infrastructure for Data Centers".


