Data visualization is the graphic representation of data. It involves producing images that communicate relationships among the represented data to viewers of the images. This communication is achieved through the use of a systematic mapping between graphic marks and data values in the creation of the visualization.
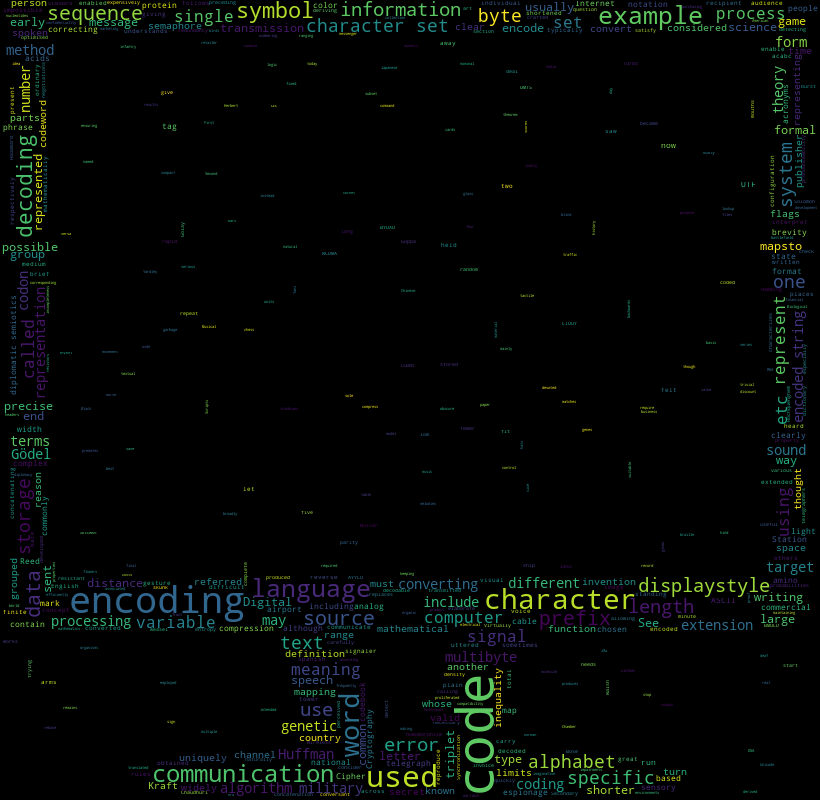
An image composed of words used in a particular text or subject, in which the size of each word indicates its frequency or importance.
Install wordcloud using a simple pip command.
pip install wordcloud
wikipedia library is used for extracting wikipedia articles on any given topic. Install it using this pip command:
pip install wikipedia
Run python script as:
python mywiki.py <query>
For example:
python mywiki.py code
will create wordcloud for the topic 'code' which looks like this:
However
mywiki.py
randomizes the number of words and images generated everytime the script is run! Have fun adding your own images and playing around with the script!